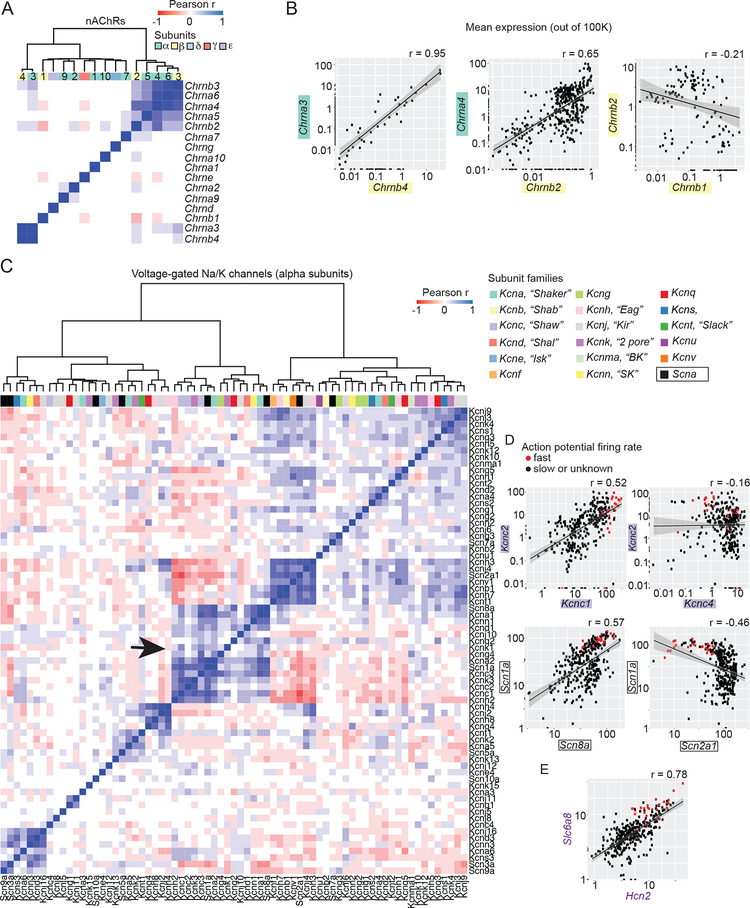
Figure 4. Inferring ion channel gene-gene co-expression relationships across hundreds of brain cell types and states.
(A-B) Nicotinic acetylcholine receptor (nAChR) subunit co-expression correlations across 565 brain cell populations. (A) Hierarchical clustering of pairwise correlations of n=16 nAChR subunit genes (color-coded by family). (B) Scatterplots of subunit expression (log10 scale). (C-E) Correlation structure among voltage-gated (VG) Na and K channels measured from 323 neuronal populations. (C) Hierarchical clustering of pairwise expression correlations. The VGK (n=17) and VGNA (n=1) alpha subunit families are color-coded and labeled. The correlation block containing channels known to control firing rate is shown with an arrow. (D-E) Select pairwise subunit expression correlations. Neuronal populations known to exhibit fast firing rates are shown in red (Figure S3D). Slc6a8 and Hcn2 were frequently correlated with the alpha subunit genes that putatively encode firing rate (Figure S3D). See also Figure S3.

