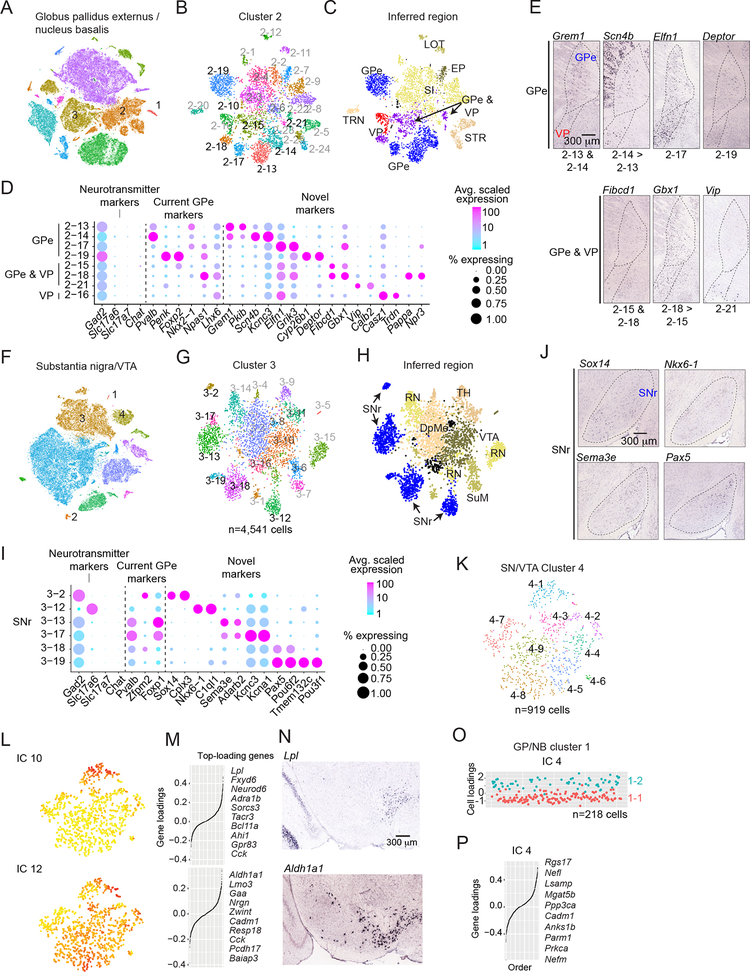
Figure 6. Transcription-based identification of known and novel neuron type distinctions within the basal ganglia.
(A-E) Globus pallidus externus (GPe). (F-J) Substantia nigra reticulata (SNr). (K-O) Dopaminergic vs acetylcholinergic neuromodulatory neuron populations. (A) tSNE plot of color-coded global clusters (n=11) for GP/NB dataset. Clusters 1, 2, and 3 are neuronal. (B) Subclusters within cluster 2. Black subclusters correspond to those of GP/NB. (C) Subclusters color-coded by candidate anatomical regions, inferred by ISH expression patterns of selective marker genes (Figure S6) and consistent with dissections (Data S1). Ventral pallidum (VP), substantia innominata (SI), striatum (STR), lateral olfactory tract (LOT), rostral entopeduncular nucleus (EP) and the thalamic reticular nucleus (TRN). (D) Dot plot illustrating the expression patterns of neurotransmitter genes, neuron type markers from the literature and novel markers identified here. (E) ISH experiments (Allen) illustrating expression within the GPe and/or VP (sagittal sections). Dotted line approximate boundaries. (F) tSNE plot of color-coded global clusters (n=14) for substantia nigra/VTA. Clusters 1, 3, and 4 are neuronal. (G) Subcluster structure within cluster 3. Black subclusters correspond to those of SNr. (H) Candidate anatomical regions inferred by ISH (Figure S6). Ventral tagmental area (VTA), red nucleus (RN), supramammillary nucleus (SuM), thalamus (TH), and deep mesencephalic nucleus (DpMe). (I) Dot plot as in (D). Genes for neurotransmitters, current SNr markers, and novel markers identified here. (J) ISH experiments (Allen) illustrating expression within the SNr (sagittal sections). (K) Subclusters within Th+/Ddc+ dopaminergic cluster 3 from the SN/VTA dataset. (L-M) Example cluster 3 ICs that encode spatial signals within the SNc/VTA. (L) IC cell loadings displayed on tSNE plot. (K). IC gene-loadings. Top ten genes shown at right.
(L) ISH experiments (sagittal sections) for Lpl (IC 10, top) and Aldh1a1 (IC 12, bottom). IC 10 identifies the dorsal VTA, while IC 12 identifies the ventral VTA and SNc (Allen). (O-P) Minimal heterogeneity identified within Chat+/Slc5a7+ cholinergic cluster 1 from the GP/NB dataset. (O) Plot of IC 4 cell-loadings. Based on IC 4, cells are assigned as subcluster 1–1 or 1–2. (P) IC 4 gene-loading plot. Top ten loading genes suggest a Neurofilament-type signal (Figure 3).

