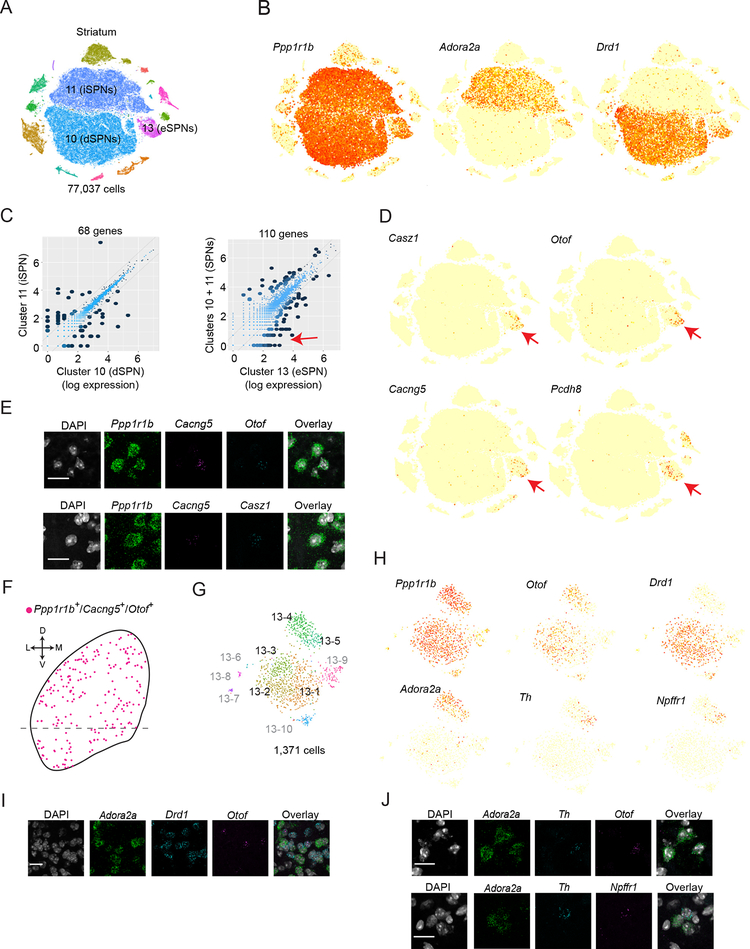
Figure 7. Eccentric spiny projection neurons represent a third axis of SPN diversity.
(A) tSNE plot of color-coded global clusters (n=15) for striatum dataset. Clusters 10, 11, and 13 are presumed SPNs. (B) Expression plot of pan-SPN marker Ppp1r1b, direct pathway SPN (dSPN) marker Drd1, and indirect pathway SPN (iSPN) marker Adora2a. Ppp1r1b+ cells within Cluster 13 are eccentric SPNs (eSPN). (C) Mean expression comparisons between SPN populations (log-normal scale). Left, cluster 10 vs cluster 11 (iSPN vs dSPNs). Right, cluster 13 vs clusters 10 and 11 (eSPNs vs d/iSPNs). Differentially expressed genes (fold ratio > 2 and P < 10−100 by binomTest (Robinson et al., 2010), STAR Methods) are shown with dark dots and totals listed above. Red arrow indicates selective expression in eSPNs. (D) Expression plot of n=4 genes (Casz1, Otof, Cacng5, and Pcdh8) enriched in eSPNs vs d/iSPNs (red arrow in C). Across all global clusters, genes are highly enriched in cluster 13 (red arrows). (E-F) eSPNs are anatomically dispersed throughout the striatum. (E) Single confocal planes from smFISH experiments validating co-expression of pan-SPN (Ppp1r1b) and highly-selective eSPN markers (Cacng5, Otof, and Casz1) in dorsal striatum. Top, Ppp1r1b, Cacng5, and Otof. Bottom, Ppp1r1b, Cacng5, and Casz1. Arrowhead indicates triple-positive cells. (F) Locations of triple positive Ppp1r1b, Cacng5, and Otof cells on a schematic of coronal striatum. D, dorsal; V, ventral; L, lateral; M, medial. (G) Color-coded subclusters from cluster 13. Subclusters 13–1, 13–2, 13–3, 13–4, and 13–5 correspond to eSPNs (83% of cells, black labels). The identity of other subclusters (17% of cells, gray labels) is described in Figure S7. (H) Expression plot of pan-SPN (Ppp1r1b), pan-eSPN (Otof), dSPN (Drd1), iSPN (Adora2a), subcluster 13–5 (Th, Npffr1) markers. (I-J) Single confocal planes from smFISH experiments validating co-expression of markers in dorsal striatum. Arrowhead indicates triple-positive cells. (I) Co-expression of Otof with Adora2a and Drd1. (J) Co-expression of subcluster 13–5 markers. Triple-positive cells in dorsal striatum are indicated with white arrowheads. Top, Adora2a, Th, Otof. Bottom, Adora2a, Th, Npffr1.

