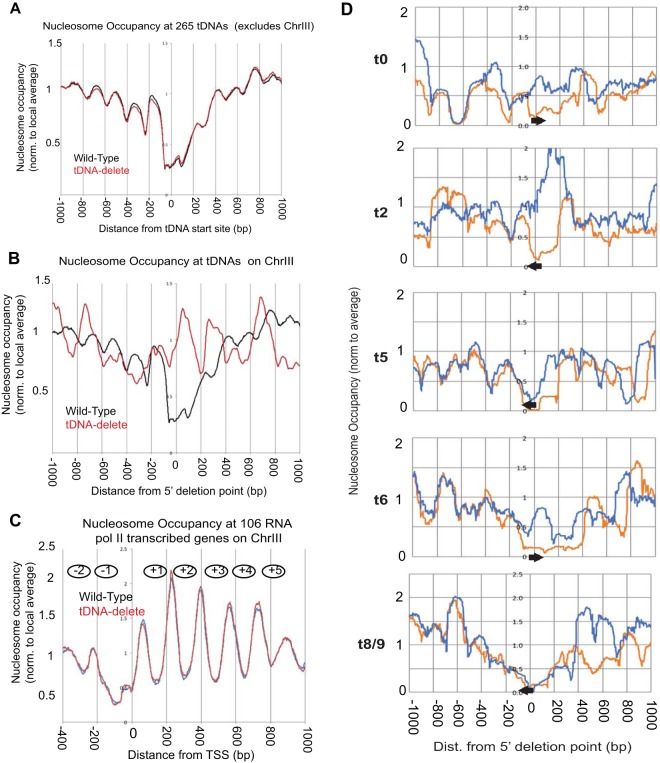
FIG 2.
Deletion of tDNAs leads to local changes in chromatin structure. (A) Comparison of nucleosome occupancy rates at 265 tDNAs on all of the yeast chromosomes except chromosome III (ChrIII). The tDNAs were aligned with respect to their transcription start sites (TSS) (set at 0). (B) Analysis of the nucleosome occupancy at tDNAs on chromosome III in the wild-type and tDNA delete strains. (C) Comparison of global nucleosome phasing on chromosome III in wild-type and tDNA delete cells. Shown are the average nucleosome dyad positions on 106 RNA Pol II-transcribed genes on chromosome III. These genes cover most of chromosome III. The genes were aligned with respect to their TSS (set at 0). The average nucleosome dyad density was set at 1. (D) MNase-seq data for wild-type and tDNA delete strains (normalized to the genomic average [i.e., 1]). Coverage plots are shown using all DNA fragments in the 120- to 180-bp range. The reference point (0) is the nucleotide marking the 5′ end of the deletion on chromosome III. Upstream of the deletion point at 0, the DNA sequence is the same in wild-type and the tDNA delete chromosomes III. Downstream of the deletion point, the DNA sequences are different. The arrows show the locations and orientations of the tDNAs in wild-type chromosome III. Meaningful plots could not be made for two tDNAs [tP(AGG)C and tS(CGA)C] because they were moved to another chromosome. Two other tDNAs [tM(CAU)C and tK(CUU)C] are present in S288C strains but are naturally absent in W-303 strains, including the strains used here. Orange, wild-type profile; blue, tDNA delete profile.

