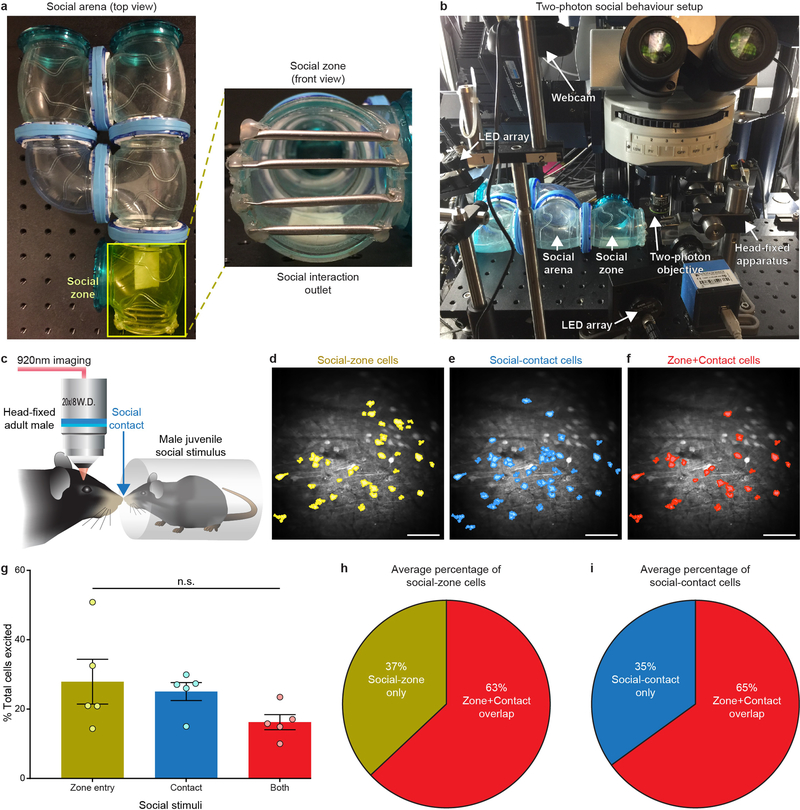
Extended Data Fig. 6 |. Head-fixed two-photon investigation of social behaviours.
a, The social-behavioural arena (left) and the opening of the social zone, where physical contact occurs between freely moving juvenile and head-fixed mice (right). b, The setup for monitoring social behaviour during in vivo head-fixed two-photon Ca2+ imaging. c, Identification of OFC cells that respond to physical contact with a juvenile social stimulus. d–f, Cell masks of social-zone (d; juvenile social-stimulus zone entry), social-contact (e; juvenile social-stimulus contact) and zone + contact-excited neurons (f) from an example animal. Images from one representative mouse; this experiment was repeated in six mice with similar results. Scale bars, 100 μm. g, The proportion of identified socialzone, social-contact, and zone + contact-excited neurons exhibited no significant differences. Mean number of juvenile zone entries = 18 ± 3, mean number of social contacts = 34 ± 6; n = 943 total cells from 5 mice, social-zone-excited mean = 54 cells ± 13, social-contact-excited mean = 48 cells ± 6.5, zone + contact-excited mean = 31 ± 4.9 cells; F2,12 = 2.1, P = 0.2, one-way ANOVA. h, i, The average percentage of social-zone (h) and social-contact (i) neurons that significantly responded during both social readouts. Neurons that exhibited a significant response to the first 5 s of social-zone entry or social contact compared to the previous 2 s of baseline activity were classified as social-zone or social-contact neurons using a two-sided Wilcoxon signed-rank test with a P < 0.05 threshold. All data are plotted as mean ± s.e.m; n.s., nonsignificant (P > 0.05).

