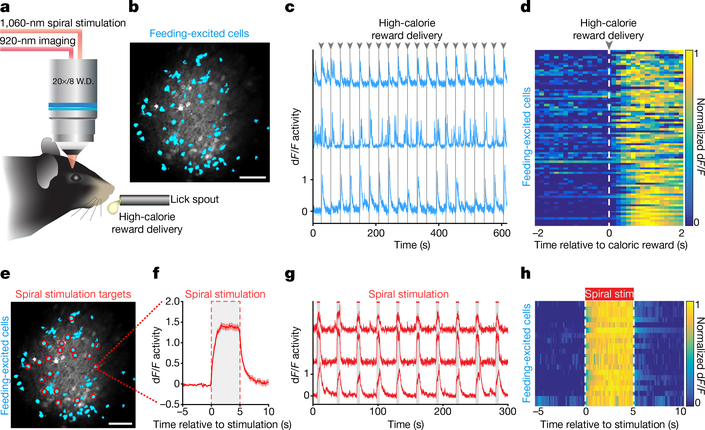
Fig. 2 |. Identifying and targeting activity-specific OFC neurons for cellular-resolution optogenetic perturbations.
a, Design for classifying feeding-responsive OFC neurons during head-fixed licking behaviour (liquid high-calorie reward delivered every 30 s across a 10-min session). b, Identified feeding-responsive cells (cyan) from a GCaMP6m-bReaChES mouse. Image from a representative mouse; the experiment was repeated in six mice with similar results. Scale bar, 100 μm. c, Example Ca2+ traces of feeding-responsive neurons reliably responding to multiple reward deliveries. d, Normalized average Ca2+ responses to caloric rewards delivered every 30 s across 20 trials from an example animal (n = 81 feeding-responsive cells). e, Individual feeding-responsive neurons were selectively targeted for spiral stimulation (n = 20 stimulation-targeted feeding cells). Scale bar, 100 μm. f, Mean Ca2+ response to 20 trials of 5-s stimulation from an individual feeding-responsive neuron. Region between dashed lines indicates stimulation period. g, Example Ca2+ traces of feeding-responsive cells displaying responses to 5-s stimulation. Note that, if desired, the method allows temporal dispersion or staggering of stimulation timing across individual cells. h, Normalized average Ca2+ activity of feeding-responsive neurons across 20 trials of 5-s stimulation (n = 20 cells).

