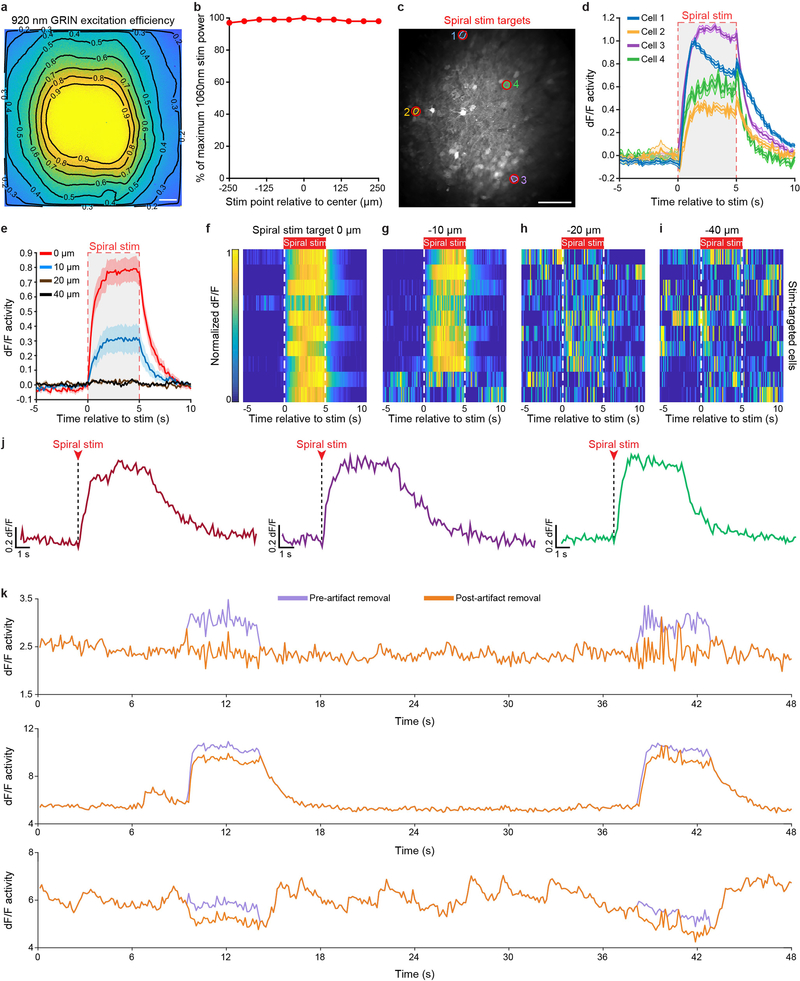
Extended Data Fig. 2 |. Characterization of spiral stimulation through a GRIN lens.
a, Heat map representing the relative probability for multiphoton absorption across the FOV of a typical GRIN lens as measured by the ratio of the normalized images from a bulk fluorescence slide acquired by multi-photon (920 nm) and single-photon (488 nm) excitation, which accounts for photon collection losses. Scale bar, 50 μm. b, The power output of the 1,060-nm stimulation beam at the distal tip of a GRIN lens is constant across the entire FOV, indicating that the most probable loss mechanism for two-photon excitation is optical aberration. Stimulation laser power readouts were obtained while moving the spiral point at 50-μm increments across the FOV (500 μm). c, Cell masks of stimulation-targeted cells near the edge and centre of the GRIN lens from an example animal. Image from a representative mouse; the experiment was repeated in n = 6 mice with similar results. Scale bar, 100 μm. d, Mean Ca2+ activity of stimulation-targeted cells near the edge of the GRIN lens is comparable to the average activity responses of stimulation-targeted neurons located near the centre of the GRIN lens (10 stim trials, n = 4 stim-targeted cells from 1 mouse). The shaded region indicates stimulation time points. e, Average Ca2+ activity in response to the spiral-stimulation targets positioned 0 μm (red), 10 μm (blue), 20 μm (brown) and 40 μm (black) away (in the x–y plane) from the centre point of each stimulation-targeted neuron (10 stimulation trials per position, 30-s interval, 5-s spiral stimulation, 10 spiral-stimulation targets, n = 10 stimulation-targeted cells from one mouse). Shaded region indicates stimulation time points. f–i, Mean Ca2+ activity of stim-targeted cells in response to the spiral point distance (in the x–y plane) of 0 μm (f), 10 μm (g), 20 μm (h) and 40 μm (i; n = 10 stimulation-targeted cells from one mouse; this experiment was repeated in n = 3 mice with similar results). j, Representative zoomed-in Ca2+ activity traces during 5-s spiral-stimulation trials. k, Example Ca2+ traces from individual neurons showing responses before (purple) and following (orange) the removal of the spiral-stimulation artefact, present in the GCaMP acquisition channel owing to non-negligible GCaMP excitation with the stimulation light source (λ = 1,060 nm) during spiral stimulation. At 30-Hz image acquisition, for every 1 ms of the spiral photostimulation duration, the photostimulation artefact would contaminate ~17 consecutive image lines with an approximately uniform background. This artefact was estimated on a per-image-line basis as the average increase in signal during the stimulation frames from the image frames which occurred without photostimulation and then removed across each image line using custom MATLAB scripts (Methods).

