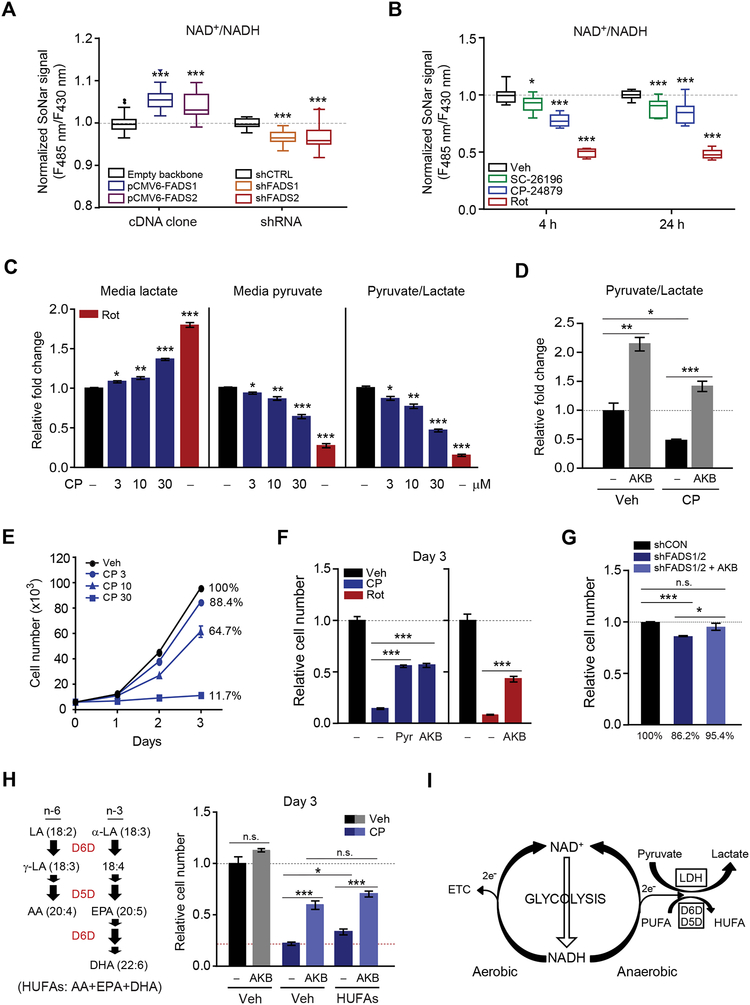
Figure 5. D5D and D6D inhibition reduces cytosolic NAD+/NADH, increases LDH activity, and impairs cell proliferation.
(A-B) Cytosolic NAD+/NADH measured with SoNar in (A) HeLa cells transfected with FADS1 or FADS2 cDNA or shRNA targeting FADS1 or FADS2; and (B) IMCD3 cells treated with rotenone (200 nM) or the desaturase inhibitors SC-26196 (10 μM) and CP-24879 (30 μM).
(C-D) Media lactate, pyruvate, and/or pyruvate/lactate ratio from IMCD3 cells treated with (C) rotenone (200 nM) or increasing concentrations of CP-24879 (CP); and (D) CP-24789 (30 μM) with or without AKB (1 mM).
(E-H) Cell proliferation at 3 days for (E) IMCD3 cells treated with increasing concentrations of CP-24789; (F) IMCD3 cells treated with vehicle, CP-24789 (30 μM), CP-24789 (30 μM) and pyruvate (1 mM), CP-24789 (30 μM) and AKB (1 mM), rotenone (200 nM), and rotenone (200 nM) and AKB (1 mM); (G) HeLa cells transfected with shRNA targeting FADS1 and FADS2 or control; and (H) IMCD3 cells treated with CP-24789 (30 μM) with AKB (1 mM) and/or a mixture containing 10 μM each of arachidonic acid (AA), eicosapentaenoic acid (EPA), and docosahexaenoic acid (DHA).
(I) Schema for D5D and D6D activity and NAD+ recycling in relation to glycolysis and lactate fermentation. Values are means ± SEM; ns, P > 0.05; *P < 0.05; **P < 0.01; ***P < 0.001; n = 20–30 for (A), n = 10 for (B), n = 3 for (C, D), and n = 4 for (E-H).
See also Figure S4.

