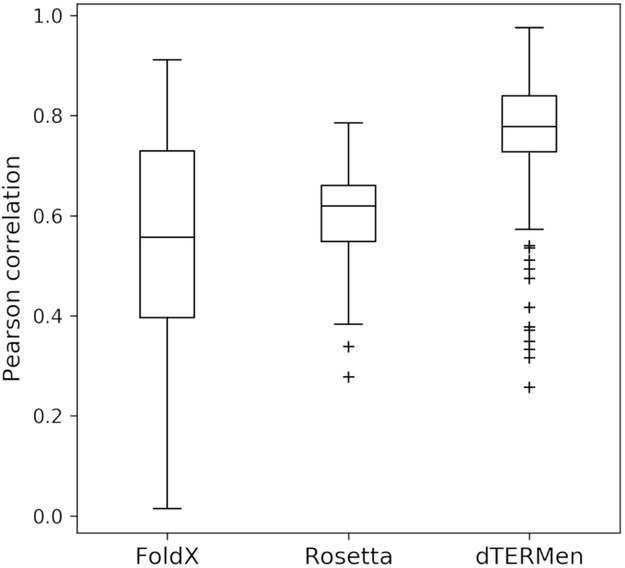
Figure 1. Prediction robustness to small differences in input structures.
Distribution of Pearson correlation coefficients (R) that reflect the similarity of scores generated from structurally similar templates (binding mode RMSD < 1 Å; see Table S3). 294 pairs of structures and 6155 unique sequences were used to generate the data. The median R value is indicated with a line, data between the first and third quartiles (Q1-Q3) are within the box, the whiskers represent extensions of Q1 and Q3 by 1.5 times the interquartile distance (Q1-Q3), and outliers show points outside the whiskers. The larger correlation coefficients obtained when using dTERMen, compared to other methods, indicate lower sensitivity to small structural differences in templates.

