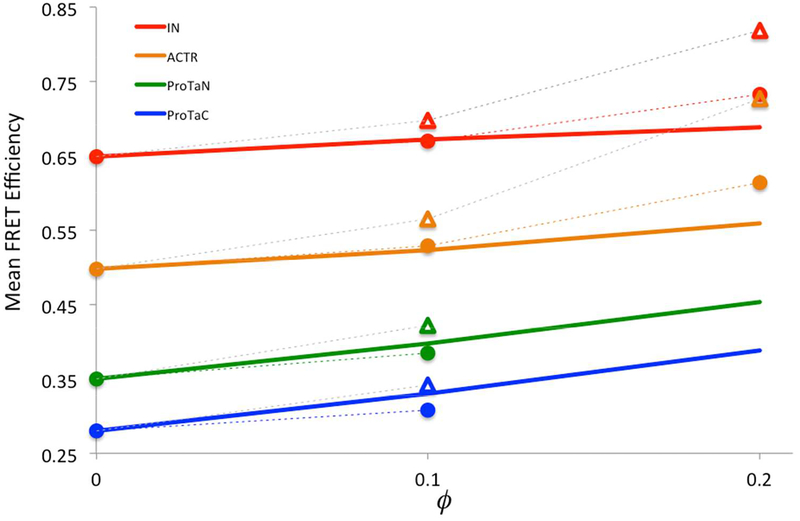
Figure 4.
Experimental and calculated mean FRET efficiencies. Experimental results are shown as solid lines, calculated results are shown as triangles or circles (connected by dash), when only steric repulsion or both steric repulsion and weak attraction between IDPs and PEG are accounted for. Calculated results are from applying FMAP on reweighted flexible-meccano conformational ensembles; errors, as estimated by bootstrapping, are less than the size of the symbols.

