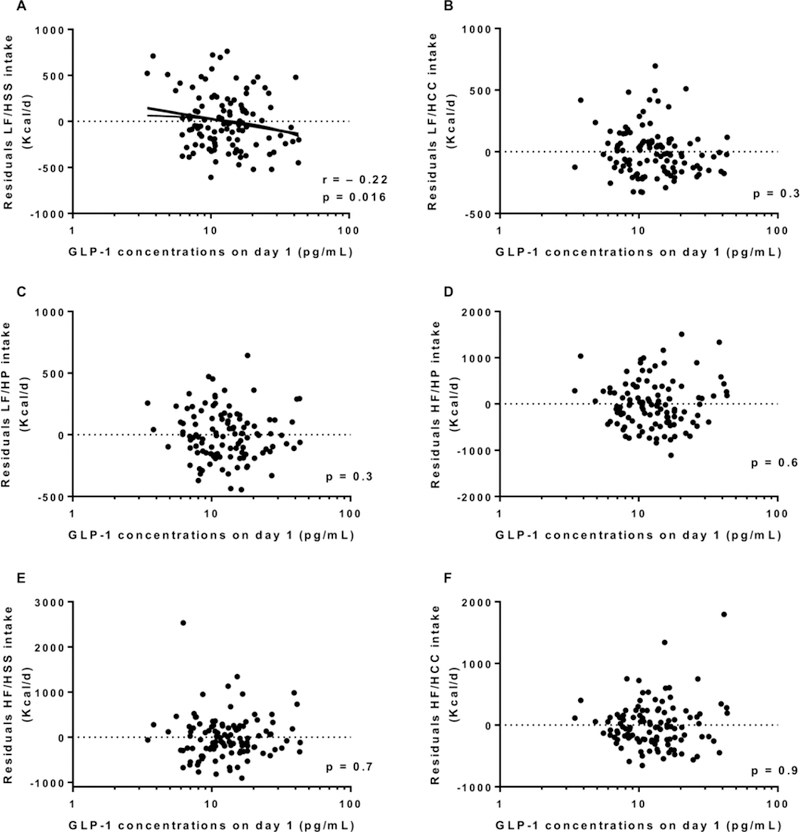
Figure 2.

Relationship between day 1 GLP-1 and 3-day daily average of energy intake from the LF/HSS food group (A), the LF/HCC food group (B), the LF/HP food group (C), the HF/HP food group (D), the HF/HSS food group (E) and the HF/HCC food group (F).
