Fig. 2.
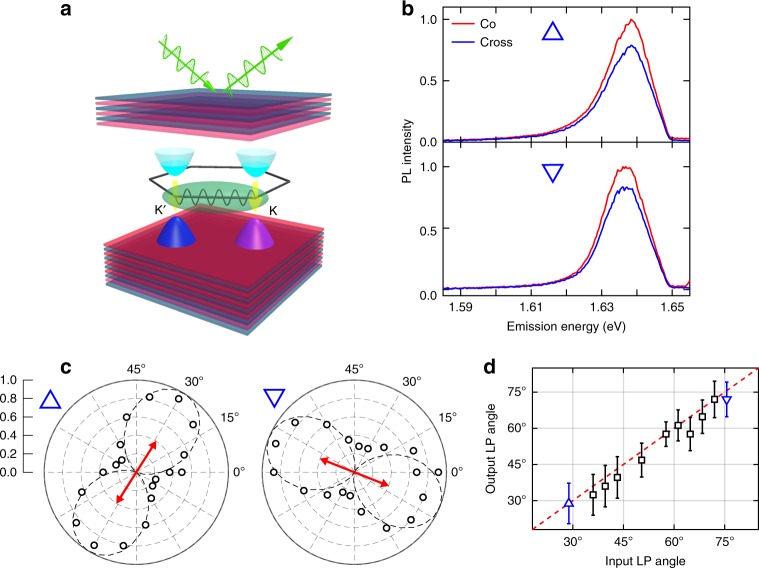
Observation of polariton valley coherence. a Schematic of coherent valley polariton states. A linearly polarized pump generates a coherent superposition of polaritons arising from the K and K′ valley. The polariton radiatively decays emitting a linearly polarized output. b PL spectrum of lower polariton when the excitation and detection polarization are aligned (Co-) and perpendicular (Cross-). c Normalized lower polariton PL intensity as a function of detection angle for given input linear polarization (red arrow). The dashed lines are fittings to extract the orientation of output polarization. Baseline (unpolarized part) has been subtracted before normalization. 0.0 and 1.0 stand for the central and outermost contour of the polar diagram, respectively. d Relationship between output and input linearly polarized (LP) angles. Dashed line is a linear fit with unity slope, which indicates the lower polariton PL has aligned linear polarization with the pump. Errorbars are extracted from least square fitting

