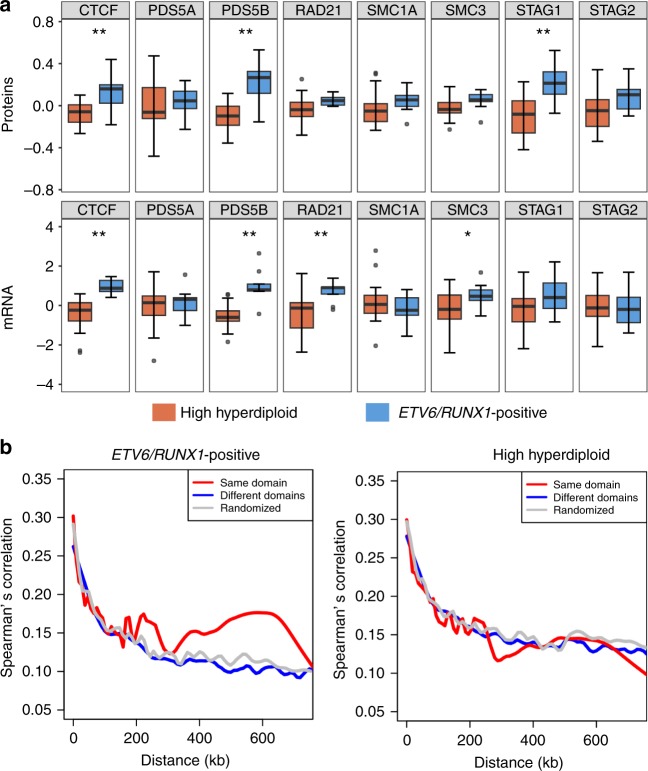
Fig. 4.
Low CTCF/cohesin expression and transcriptional dysregulation in high hyperdiploid leukemia. a Boxplots of the expression of CTCF and members of the cohesin complex in proteomics (top) and RiboZero RNA-sequencing datasets (bottom). Low expression of CTCF/cohesin complex members was seen in the high hyperdiploid subgroup at both the RNA and protein levels. The center of the boxplot is the median and lower/upper hinges correspond to the first/third quartiles; whiskers are 1.5 times the interquartile range and data beyond this range are plotted as individual points. b Spearman’s correlation coefficient between gene pairs as a function of distance across the oligo(dT) RNA-sequencing dataset for ETV6/RUNX1-positive cases (left; n = 39) and high hyperdiploid ALL (right; n = 44). The analysis showed that the expression of gene pairs in the same topologically associating domain (TAD; red) displayed higher correlation than those in different domains (blue) or randomly selected regions (gray) in ETV6/RUNX1-positive cases, whereas no difference was seen in high hyperdiploid ALL, suggesting that transcriptional dysregulation in hyperdiploid cases is related to TAD borders

