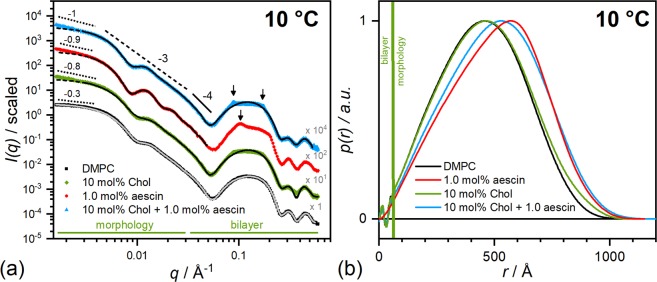
Figure 8.
Model-independent SAXS results for samples with 1 mol% aescin at 10 °C. (a) Scattering curves and fits from the IFT analysis (solid lines). The data for DMPC is on absolute scale (cm−1). The other ones are scaled by the multiples in grey. The meaning of the slopes is explained in the main text (−3 and −4 apply for all curves). The p(r) functions calculated are shown in panel (b). Normalization from 0–1 guarantees better comparability.

