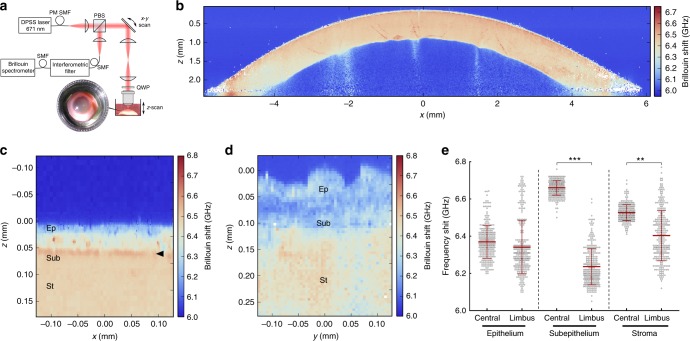
Fig. 1.
The corneal limbus has distinct mechanic properties. a Schematic representation of the Brillouin spectro-microscope (DPSS laser diode-pumped solid-state laser; PBS polarising beam-splitter; QWP quarter-wave plate; PM-SMF polarisation-maintaining single-mode fibre), showing the confocal microscope, elastic scattering filter, VIPA spectrometer, and the sample in its immersion medium. Whole human corneas maintained intact after enucleation were kept immersed in Carry-C to preserve the tissue’s natural thickness, hydration, and transparency state (inset) during Brillouin spectro-microscopy (BSM). b Representative organ-wide X–Z scans of Brillouin frequency shifts from healthy intact human corneas (n = 3). Brillouin spectra were acquired with a sample spacing of 20 µm, over a 12 × 3 mm (600 × 150 = 9 × 10⁴ points) X–Z transverse section, corresponding to the full corneal width and depth, respectively. These high-resolution scans revealed transversal striæ with high-Brillouin frequency shifts, mostly in the posterior stroma and extending obliquely to the mid or anterior region of the tissue, which probably corresponded to lamellar undulations thought to protect the stromal ultrastructure and shape from external mechanical shocks and the subsequent increase in intraocular pressure65. c Representative Y–Z scan of Brillouin frequency shifts of central cornea performed every 2.5 µm, showing a distinct epithelium (Ep; depth = 0–50 µm), sub-epithelial layer (Sub; 50–65 µm), and stroma (St; >65 µm), as well as the location of the Bowman’s layer (arrowhead). d Representative Y–Z-scan of Brillouin frequency shifts of corneal limbus performed every 5 µm, showing the epithelium (depth = 0–50/60 µm), sub-epithelial layer (60–120 µm), and stroma (>120 µm). e BSM measurements performed through the anterior region of the central cornea and limbus were statistically analysed (two-way ANOVA; 100 individual measurements per area, per experiment), along with the average (centre line) ± S.D. values (whiskers) from three independent experiments (n = 3; **p < 0.01 and ***p < 0.001). Shift value distribution was consistently similar between individual corneas but distinct in central vs. limbus

