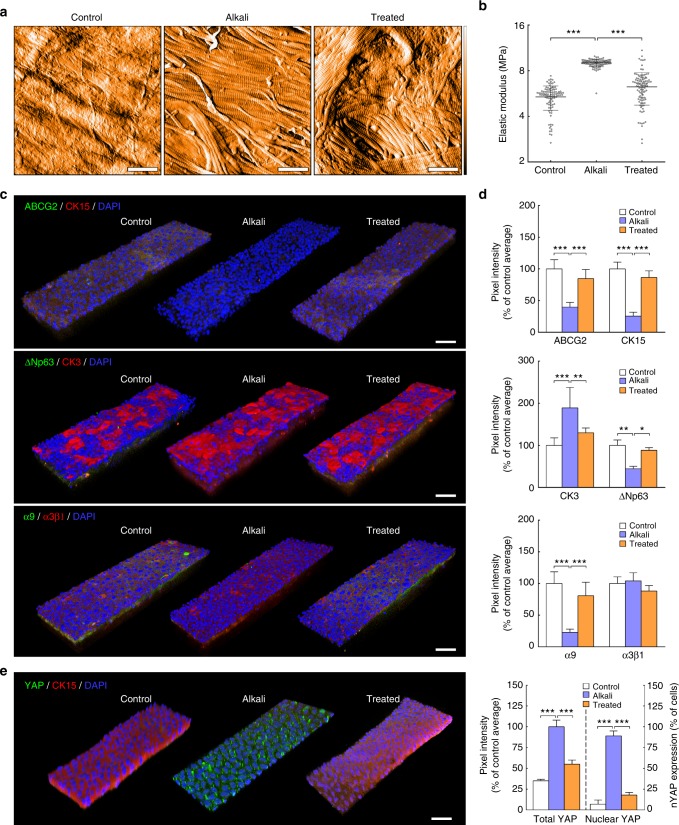
Fig. 6.
Softening of alkali-burned corneal tissue with collagenase restores expression of limbal markers ex vivo. a Representative topography of limbal sub-epithelial matrix after application of PBS (control), 0.5 M NaOH (alkali), or NaOH followed by collagenase softening (treated) of whole human corneas, analysed by atomic force microscopy (AFM). AFM scans from three independent experiments showed clearance of ECM components other than collagen fibrils in tissue subjected to alkali burn, and reduced collagen fibril density after collagenase treatment. False colour depth, 500 nm. b Force–distance spectroscopy analysis showed that the burn (alkali) significantly stiffened the limbal sub-epithelial matrix, and that subsequent collagenase softening (treated) restored the mechanical properties of the original tissue (control). The graph represents the distribution of calculated values of elastic modulus, E (MPa), and corresponding average (centre line) ± S.D. (whiskers) from three independent experiments (n = 3; ***p < 0.001). c Representative confocal immunofluorescence micrographs (3D reconstruction) of re-epithelialised limbus after alkali burn and collagenase treatment, with (d) corresponding marker expression quantification. Epithelial cells repopulating the alkali-burned limbal tissue ex vivo expressed significantly lower levels of limbal markers ABCG2, ΔNp63, CK15, and integrin-α9 while showing higher expression of CK3 differentiation markers compared to cells growing on control tissue. e The mechanotransduction marker YAP also changed significantly in tissues made stiffer by alkali, with repopulating cells showing increased YAP expression and a predominant nuclear localisation. However, collagenase treatment successfully restored the ability of burned limbal tissues to support cells expressing LESC, differentiation, and mechanotransduction markers at control levels. Cell nuclei were detected using DAPI. Marker expression was represented as average ± S.D. from three independent experiments (n = 3; *, **, and *** corresponds to p < 0.05, 0.01, and 0.001 after one-way ANOVA, respectively). Source data are provided as a Source Data file. Scale bars, 1 µm (a), 50 µm (c, e)

