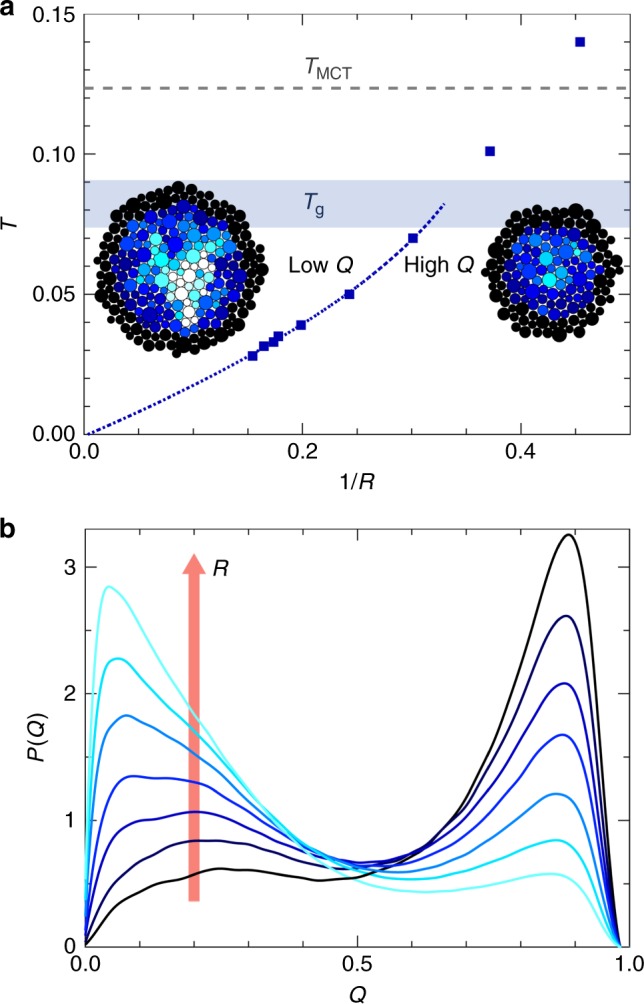
Fig. 3.

Approaching the random first-order transition. a Phase diagram showing the low-Q region for large cavities and high-Q region for small cavities, separated by the boundary determined by the point-to-set correlation length, ξPTS. The dashed blue line is the same quadratic fit (after unit conversion) as in Fig. 2b. Inset: Representative configurations with overlap field for T = 0.035 at R = 6.6 (low Q, white) and 4.8 (high Q, dark). b Evolution of the probability distribution function of overlap P(Q) at T = 0.035 from R = 4.8 to R = 6.6. Bimodality signals a first-order-like phase coexistence
