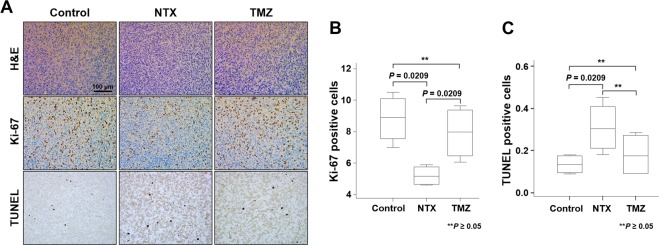
Figure 3.
Quantification of immunohistochemistry studies. (A) Histological images representing hematoxylin and eosin staining for morphology of tumor (1st row), immunohistochemistry images of Ki-67 for cellular proliferation (2nd row), and TUNEL staining for DNA damage (3rd row) for control, NTX, and TMZ group, respectively. Scale bar is 100 µm in ×200. (B) Significantly decreased expression of Ki-67 reflects the decreased cell proliferation in NTX-treated animals (P = 0.0209) compared with the control. The Ki-67 expression was significantly increased in TMZ-treated mice (P = 0.0209) compared to that in NTX-treated mice. No significant difference was observed between control and TMZ-treated mice. (C) Significantly increased TUNEL positive cells reflects the increased DNA damage in NTX-treated animals (P = 0.0209) compared with that in the control animals. No significant changes in DNA damage were observed between untreated and TMZ-treated mice (P = 0.5637) or NTX and TMZ-treated mice (P = 0.2482). Data are represented as median with an interquartile range of four independent experiments.

