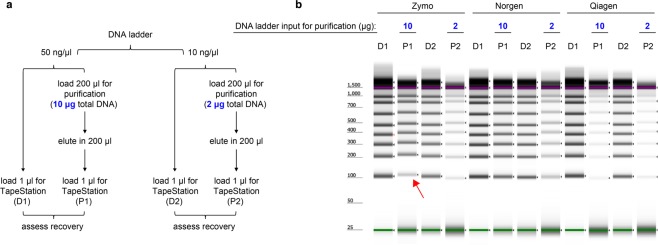
Figure 3.
Comparison of DNA recovery of a ladder consisting of fragments as short as 100 bp using the Zymo Quick-DNA faecal/Soil Microbe Miniprep Kit (Zymo), the Norgen Stool DNA Isolation Kit (Norgen), and the QIAamp DNA Stool Mini Kit (Qiagen). (a) For direct visualization of DNA recovery from the three different purification processes, DNA ladder was either loaded directly onto TapeStation (D) or was subjected to one of the three purification protocols before being loaded onto TapeStation (P). Please note that band intensities between lanes D1 and D2 are not directly comparable because the higher input into D1 lanes may be beyond the linear range of the assay. In a 100% recovery scenario, the D and P lanes should contain the same amount of DNA. (b) A representative image of gel electrophoresis on TapeStation. The size marker lane was cropped out for clarity (the uncropped, full-length gel is presented in Supplementary Fig. S1). The purple and green lines in each lane represent internal upper and lower markers, respectively, for sizing and alignment. The red arrow denotes low recovery of the 100 bp band from the Zymo-extracted ladder samples.

