Figure 7.
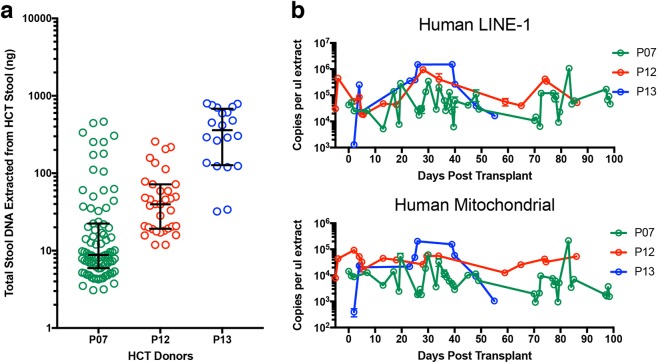
Quantification of host DNA from human patient stools using ddPCR. (a) Total DNA recovered from two side-by-side DNA isolations from 69 stool samples from three hospitalised patients (P07, P12, and P13) undergoing allogeneic HCT. Each circle represent DNA recovered from a single DNA extraction. The horizontal lines represent the median and interquartile range. (b,c) Human DNA quantified using human LINE-1 (60-bp amplicon) and mitochondrial (83-bp amplicon in the ND5 gene) assays. Error bars in (c–f) represent range of copy numbers from single ddPCR reactions on the duplicate DNA extraction. For some points, the error bars would be shorter than the height of the symbol. In these cases, the error bars were not drawn.

