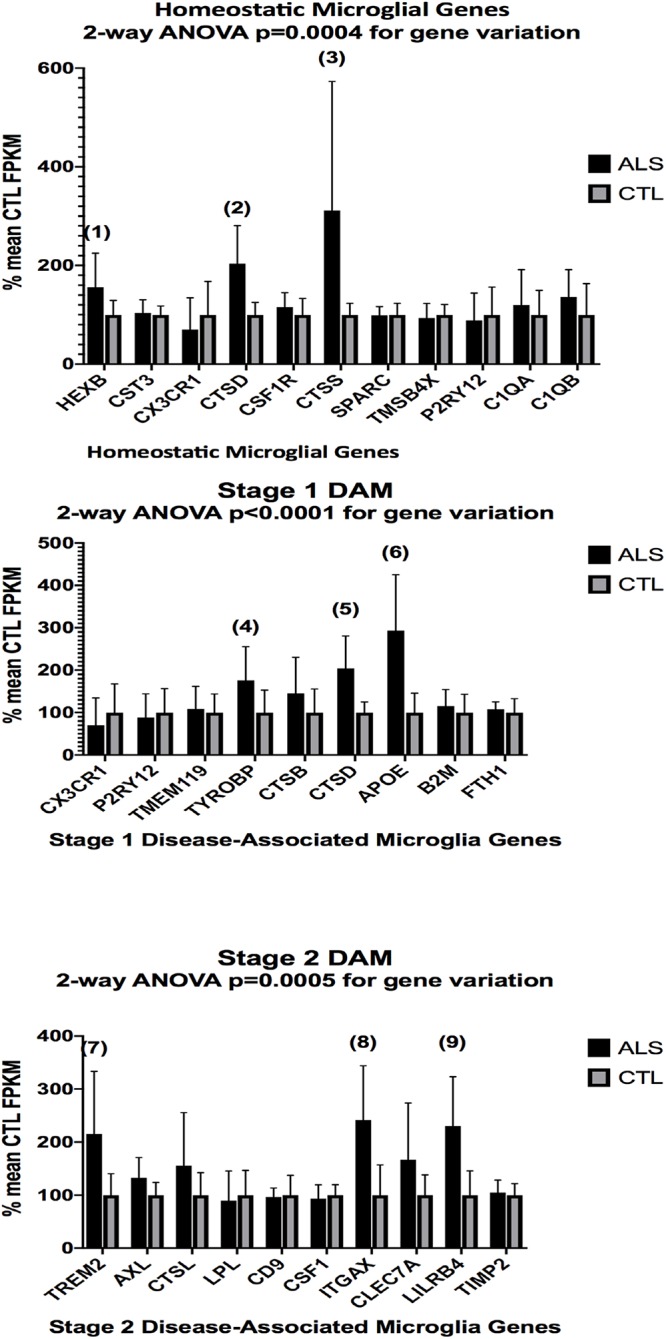
Figure 3.

Expression of genes associated with homeostatic microglia (top graph), Stage 1 DAM (middle graph), and Stage 2 DAM (bottom graph) according to Keren-Shaul et al. (2017) in ALS and CTL cervical spinal cord samples. Gene alignments were based on paired-end (PE) Illumina sequencing of rRNA-depleted tissue total RNA, followed by removal of sequencing adapters (Trimmomatic®) and alignment against the hg38 version of the human genome using Tophat2/Bowtie2 and quantitation with Cufflinks. All samples with mean CTL FPKM <2.0 were removed. Data are expressed as average ±SD of mean CTL gene expression. Two-way ANOVA results are shown in each graph. Unpaired t-tests for significance showed: (1), p = 0.055 (nearly significant); (2), p = 0.0032; (3) p = 0.040; (4), p = 0.046; (5), p = 0.0032; (6), p = 0.0018; (7), p = 0.021; (8), p = 0.0050; (9), p = 0.0038. n = 7 AlS and 8 CTL.
