Figure 4.

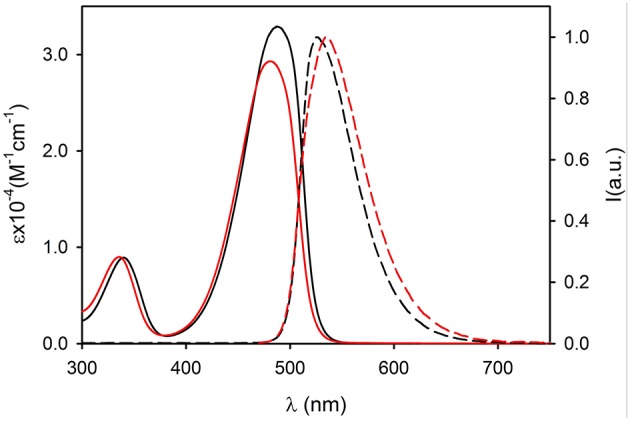
Absorption (continuous lines) and fluorescence spectra (dashed lines, λexc = 450 nm) of compound 2 (black, dichloromethane) and of 2NP (red, PBS).

Absorption (continuous lines) and fluorescence spectra (dashed lines, λexc = 450 nm) of compound 2 (black, dichloromethane) and of 2NP (red, PBS).