Figure 3.
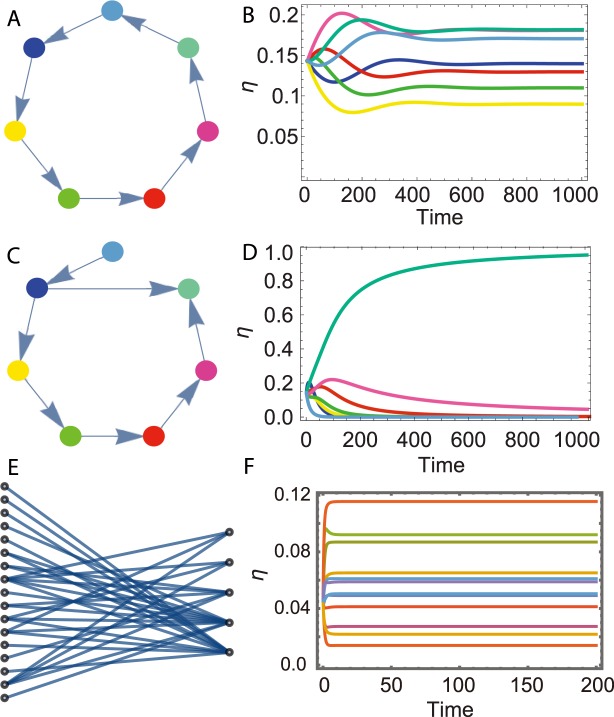
The results of the mean field predictions. (A) Species interaction network for 7 species where each species i has one mutualistic partner j, i.e. Mij = 1, = 1, = 1. (B) Time evolution of the populations of the 7 species as predicted by the mean field dynamics Eq. (2). (C) Species interaction network for 7 species where one species is not helped by any species and the iterative pruning process, as described in the main text, leads to a cascade of extinctions. (D) As the time evolution of the mean field Eq. (2), only one species dominates the community. (E) Nested structure for fruit eating birds community in Mexico39. (F) All species coexist, as predicted by our theoretical framework. In the ordinate axis use the notation and not η.

