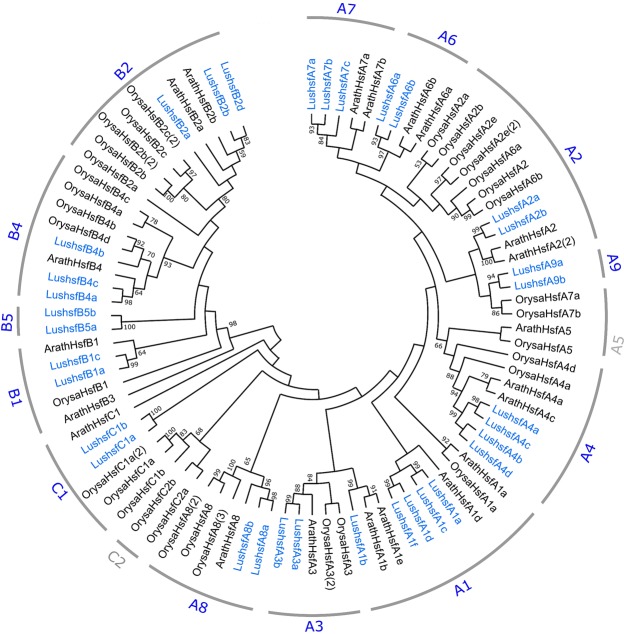
Figure 2.
Phylogenetic clustering of LusHSFs, AtHSFs and OsHSFs. The phylogenetic relationship tree was inferred from the Maximum Likelihood (ML) method and JTT + G + I matrix-based model in MEGA-X. Domain-centric alignment of amino acid sequences from DBD and OD domains were performed using the MUSCLE algorithm with maximum 16 iterations. Thirty-four LusHSF, 21 AtHSF and 33 OsHSF proteins were clustered into 3 broad classes A, B, and C and 15 sub-classes within. Sub-groups marked in grey did not consist any LusHSFs. Bootstrap support values of >50% are shown on the nodes.

