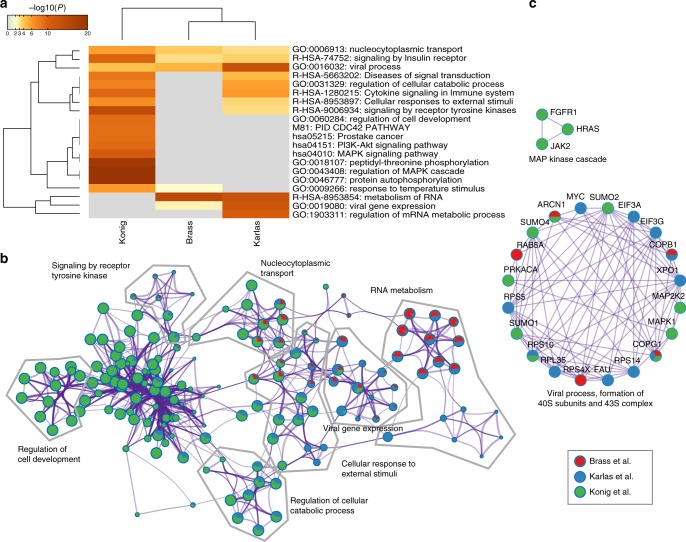
Fig. 3.
Visualizations of meta-analysis results based on multiple gene lists. a Heatmap showing the top enrichment clusters, one row per cluster, using a discrete color scale to represent statistical significance. Gray color indicates a lack of significance. The category GO:0016032 (viral process) is common to all studies, while GO:0046777 (protein autophosphorylation) is enriched exclusively in a single study, and is therefore likely a process associated with one particular experimental system. b Enrichment network visualization for results from the three gene lists, where nodes are represented by pie charts indicating their associations with each input study. Cluster labels were added manually. Color code represents the identities of gene lists. The network shows that processes such as viral gene expression, nucleocytoplasmic transport, and cellular response to external stimuli are generally shared among all three lists. RNA metabolism is shared between the Brass and Karlas lists; cellular development processes are mostly shared between the Karlas and Konig lists. c Selected MCODE components identified from the combined list of 541 genes, where each node represents a protein with a pie chart encoding its origin. The complex related to viral process is shared among all three lists, while the complex related to the MAP kinase cascade is specific to the Konig list. Supplementary Figure 12 presents all MCODE components identified

