
FIGURE 5.
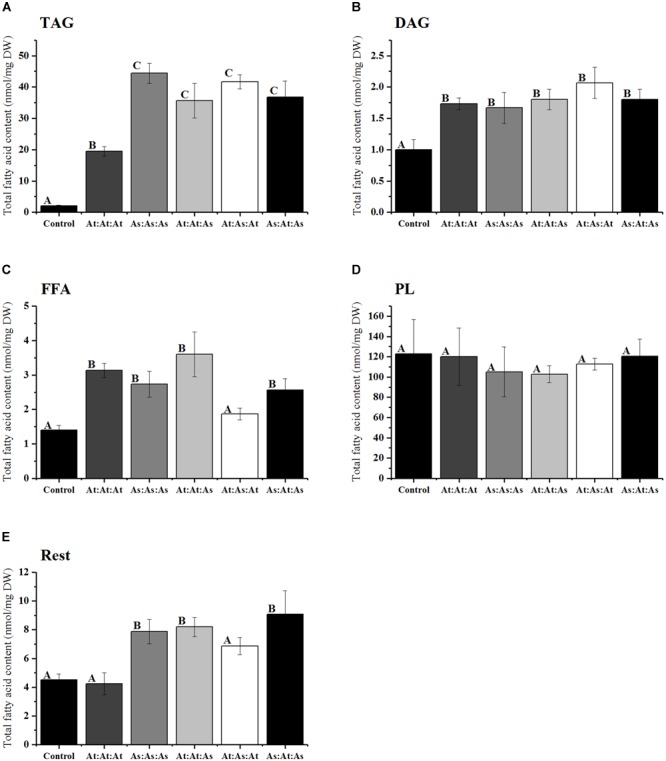
Fatty acid analysis of different lipid classes (nanomoles per milligram dry weight) from infiltrated N. benthamiana leaf tissue infiltrated with five different constructs of WRI1 permutations consisting of the WRI1 N-region, AP2-region, and C-region, respectively, and where these domains originated from either AtWRI1 or AsWRI1. (A) TAG; triacylglyceride, (B) DAG; diacylglycerol, (C) FFA; free fatty acids, (D) PL; polar lipids, and (E) Rest fraction. Bars represent average from three biological replicates. Error bars = SD. Letters indicate significantly distinguishable groups based on Tukey’s test with cutoff at P ≤ 0.05.