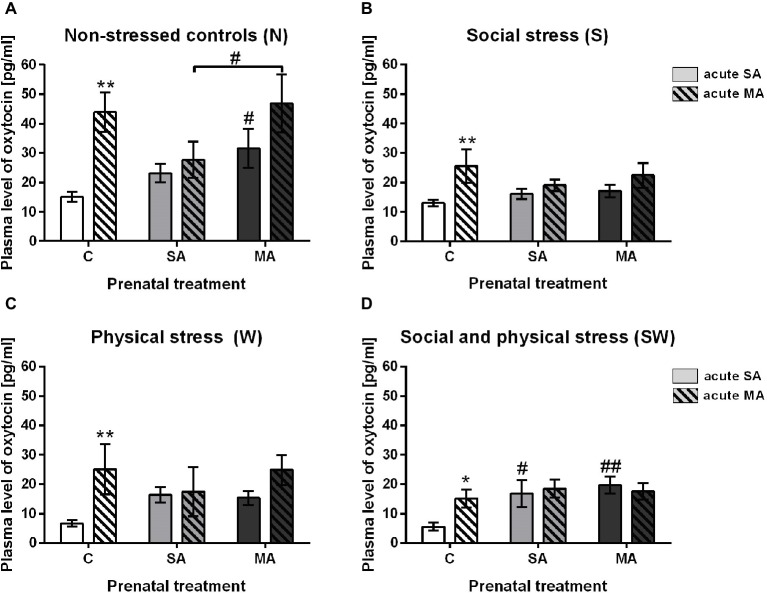
Figure 2.
The effect of acute drug administration relative to prenatal treatment. (A) Non-stressed controls, (B) social stress, (C) physical stress, and (D) social and physical stress. Values are shown as means ± SEM. C, control; SA, saline; MA, methamphetamine. *p < 0.05 and **p < 0.01 indicate significant differences between acute SA and acute MA administration in appropriate prenatal groups. #p < 0.05 and ##p < 0.01 indicate significant difference between C and SA or C and MA groups of the appropriate acute treatment.

