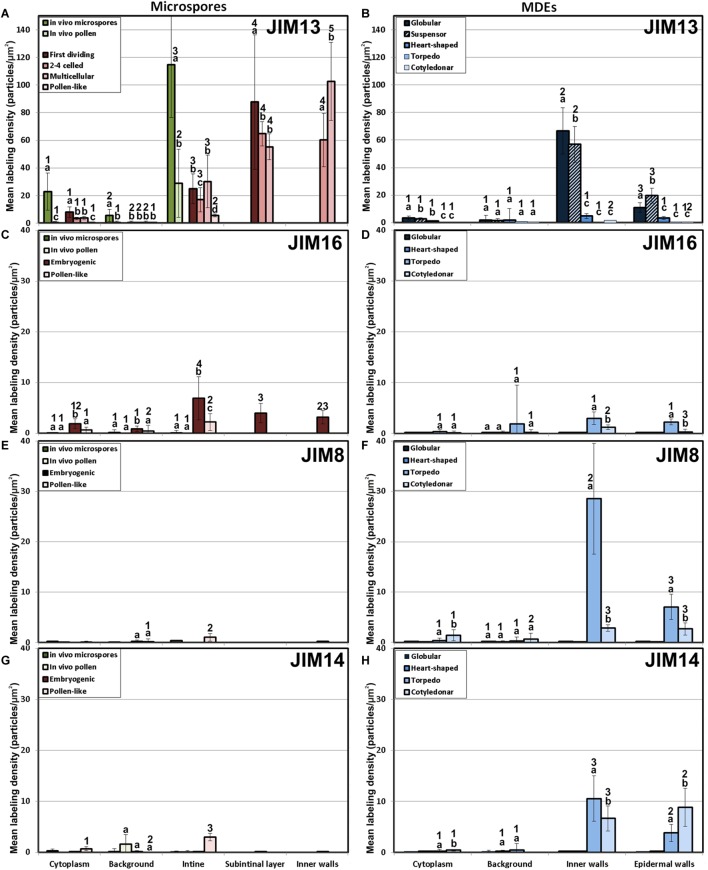
FIGURE 2.
Quantification of AGP immunogold labeling with JIM13 (A,B), JIM16 (C,D), JIM18 (E,F) and JIM14 (G,H) in in vivo microspores and pollen grains, and during microspore embryogenesis and MDE development. Quantification is expressed as mean labeling density in the Y-axis. For each subcellular region, different letters indicate significant differences in mean labeling density among developmental stages. For each developmental stage, different numbers indicate significant differences among subcellular regions.

