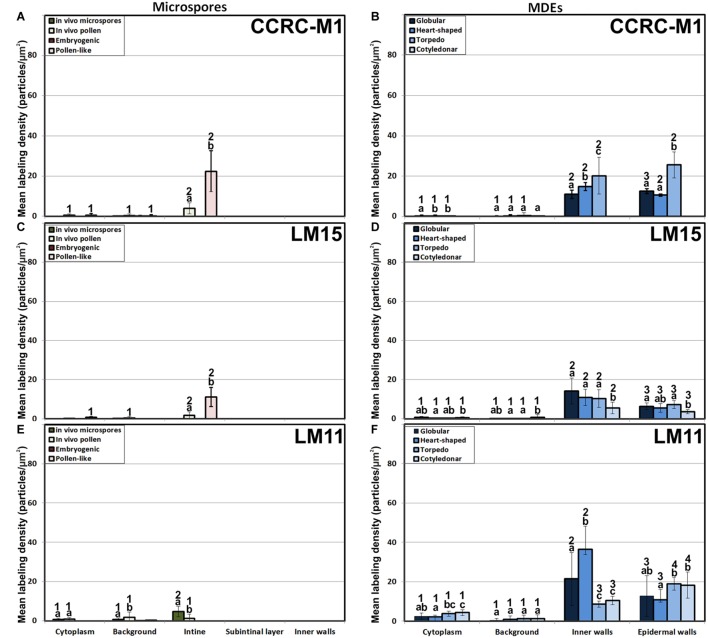
FIGURE 7.
Quantification of xyloglucan and xylan immunogold labeling with CCRC-M1(A,B), LM15 (C,D) and LM11 (E,F) in in vivo microspores and pollen grains, and during microspore embryogenesis and MDE development. Quantification is expressed as mean labeling density in the Y-axis. For each subcellular region, different letters indicate significant differences in mean labeling density among developmental stages. For each developmental stage, different numbers indicate significant differences among subcellular regions.

