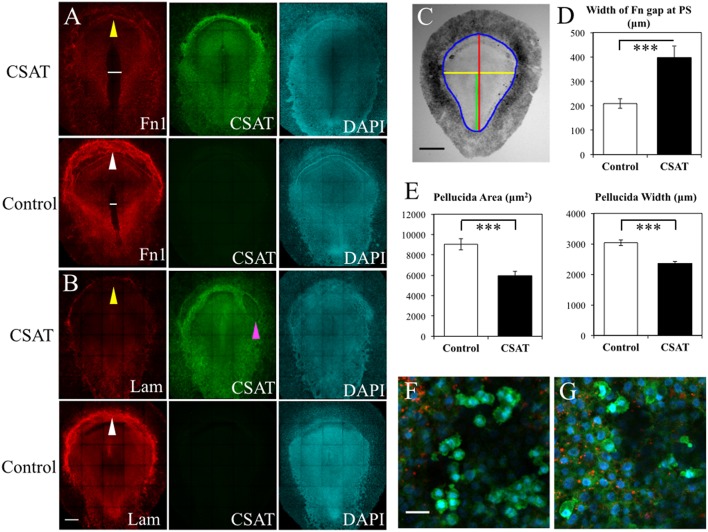
Figure 12.
CSAT antibody decreases the amount of fibronectin in the germinal crescent. Whole-mount immunofluorescence for fibronectin (abB3/D6), and laminin (ab31-2) in HH5 quail embryos following injection of CSAT antibodies or control serum. All images are maximum intensity projections of tiled 10x confocal Z stacks taken from the dorsal aspect. (A) From left to right: fibronectin, CSAT antibody and DAPI cell nucleus marker of a CSAT injected (first row) and a serum injected control embryo (second row). The line in A indicates the region around the primitive streak that lacks fibronectin compared to the same region in the control embryo below. (B) Same pattern as (A) but with laminin immunofluorescence. White arrows in control fibronectin and laminin labeled embryos indicate the germinal crescent region with widespread mature ECM fibrils compared to the same regions in CSAT injected embryos (yellow arrows). The magenta arrow in (B) CSAT indicates a region where the ectoderm/epiblast has separated from the underlying mesoderm, a pattern which was seen in several CSAT injected embryos. Scale bar = 500 μm. (C) Bright-field stereomicroscope image of a control embryo showing the histomorphometry parameters measured. Blue = area pellucida and area opaca perimeter. Red = length of the area pellucida along the central axis. Yellow = width of the area pellucida at Hensen's node. Green = length of the primitive streak (PS) from Hensen's node to the caudal boundary of the area opaca. Scale bar = 1 mm. (D–E) Control vs. CSAT embryo group means ± standard error of the mean for histomorphometry measurements. (D) width between the fibronectin rich areas lateral to the PS in the tissue layers ventral to the epiblast. (E) Pellucida area (left) and pellucida width (right). Two tailed, paired Student's T-Test. ***P < 0.001. For additional measures, see Video S5. (F) Captured frame from time-lapse imaging of a HH5 [Tg(hUbC:H2B-Cerulean-2A-Dendra2)] before injection with CSAT antibodies. (G) Same embryo as in D, imaged post-CSAT antibody injection. Fibronectin (red), Dendra2 (green), H2B-Cerulean (blue). See Videos S7, S8 for the full time-lapse movies. PGC motility morphology appears unchanged after CSAT antibody injection. Scale bar = 25 μm.

