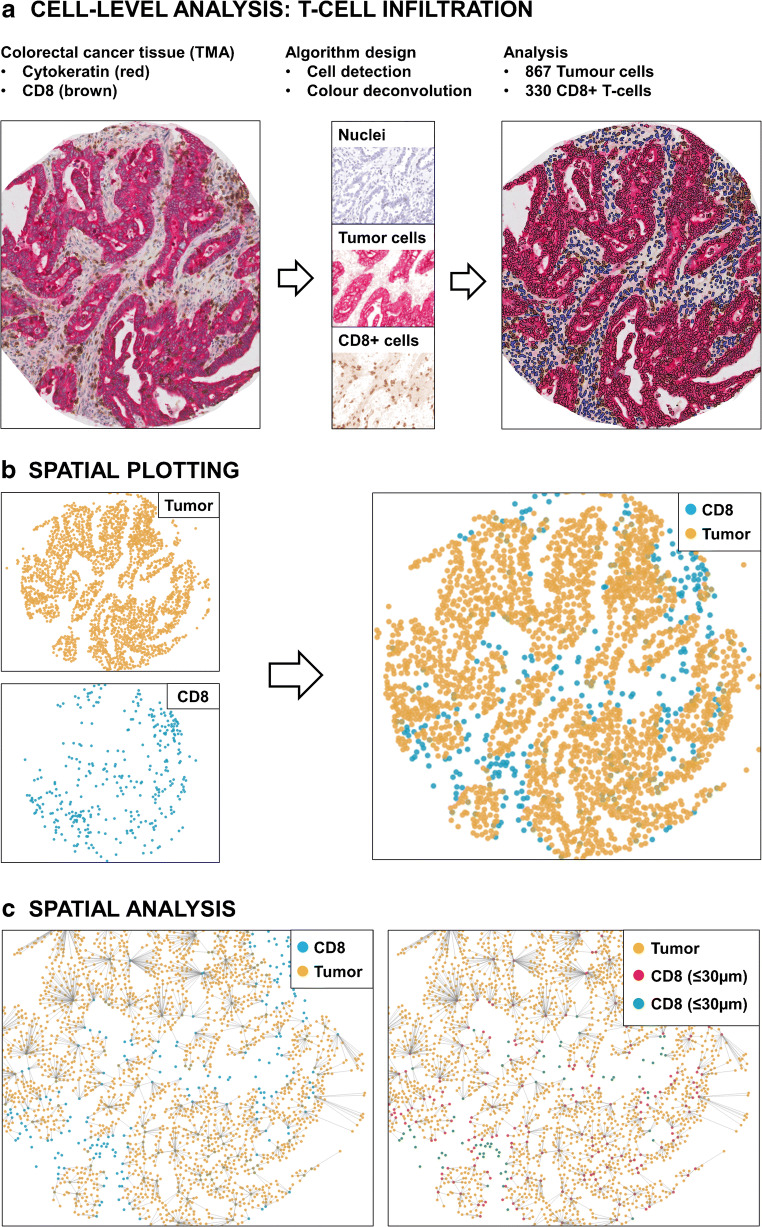
Fig. 2.
Spatial analysis of tumor immune cell infiltration. a Colorectal adenocarcinoma tissue microarray (TMA) spot stained for cytokeratin (Fast Red) and CD8+ T cells (DAB) with hematoxylin as a nuclear counterstain (left). Computational color deconvolution is performed for separate detection of cell nuclei, Fast Red, and DAB reaction products (middle), followed by nuclear segmentation and scoring of all cell populations (tumor cells: red; CD-8+ T cells: brown; marker negative cell nuclei: blue). A total of 1.623 cells were detected in this sample including 867 tumor cells, 330 CD8+ T cells, and 644 marker-negative cells. b Spatial plotting implemented on the HALO™ platform showing the localization of 867 cytokeratin positive tumor cells and 330 CD8+ T cells in this TMA spot. This allows to extract precise data on the relative distribution of T cells to the intraepithelial and stromal compartment in the tumor microenvironment. In this sample, 112 CD8+ T cells (or 33.9%) are localized to the intraepithelial compartment, while 218 CD8+ T cells (or 66.1%) localize to the tumor stroma. c Recording of the x-y coordinates in the tissue sample allows to define cell-cell relations by spatial analysis, such as the definition of nearest neighbor relationships between the tumor and CD8+ cell population (left) as well as the extraction of precise cell-cell distance measures (right)

