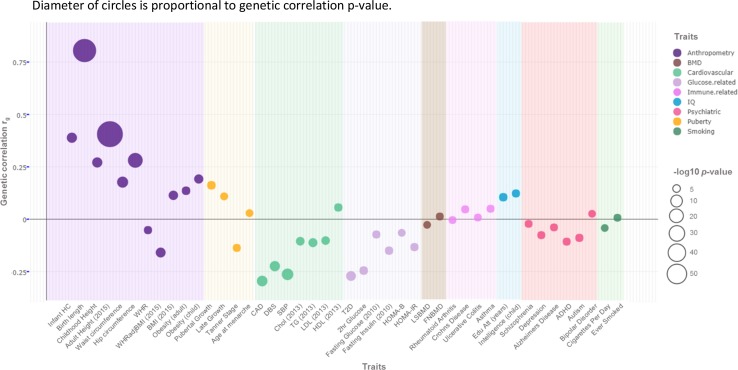
Fig. 2.
Genome-wide genetic correlation between birth weight and a range of traits and diseases in later life. Genome-wide genetic correlations between birth weight and traits and diseases evaluated in later life. The figure (adapted from Horikoshi et al. 2016 [28] with permission of the authors) displays the genetic correlations between birth weight and a range of traits and diseases in later life as estimated using LD Score regression. Traits selected were those for which genome-wide association summary statistics were available in suitably large sample sizes, and the analyses were typically performed on the largest meta-analyses available as of early 2016. The genetic correlation estimates (rg) are colour coded according to phenotypic area. Allelic direction of effect is aligned to increased birth weight. Size of the circle denotes the significance level for the correlation (per the key). Correlations with a lower significance level are not depicted. Further detail on the methods and studies involved is available in Horikoshi et al. 2016 [28]. Diameter of circles is proportional to genetic correlation p value

