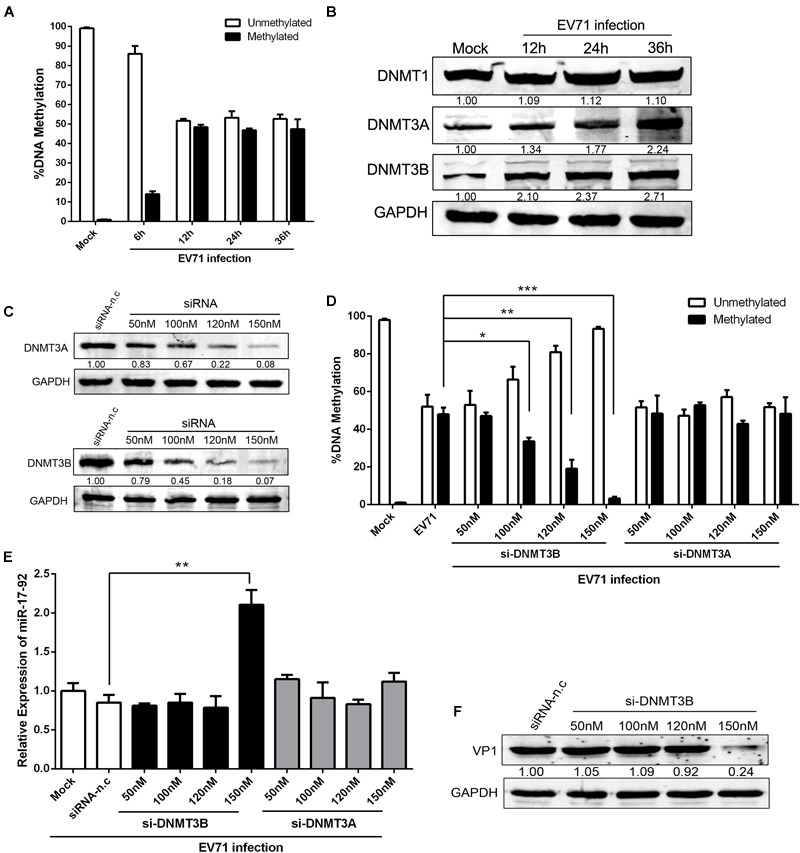
FIGURE 4.

Altered DNA methylation of the CpG island in the miR-17-92 cluster promoter in EV71 infection cells. (A) DNA was isolated from mock and EV71-infected cells (n = 3). Data were presented as the average percent of unmethylated or methylated DNA of the miR-17-92 promoter. Statistical difference was determined by comparing the % unmethylated with % methylated for each group using QIAampDNA Mini Kit. (B) Western analysis of the expression levels of DNA methyltransferase (DNMT) enzymes 1, 3A, and 3B in EV71-infected HT-29 cells at the indicated time point. (C) HT-29 cells were transfected with DNMT3A- or 3B-specific siRNA for 48h and then detected by Western blot. The numbers represent the relative density of the band in comparison to the corresponding negative control normalized to GAPDH. Value of siRNA-n.c treatment is set at 1.00 (100%). (D) HT-29 cells were transfected with DNMT3A- or 3B-specific siRNA for 24 h and infected with EV71 at an MOI of 1. DNA was isolated and methylated DNA of the miR-17-92 promoter was determined by QIAampDNA Mini Kit. Shown is the percentage of DNA methylation, n = 4. (E) Pri-miR-17-92 cluster expression in cells transfected with si-DNMT3A- or 3B for 24 h and then infected with EV71 at an MOI of 1. (F) HT-29 cells was infected with EV71 (MOI = 1) prior to being transfected with si-DNMT3B for 24 h. EV71 VP1 protein expression level was determined via Western blot. Data were mean ± SEM of fold change and representative of at least three independent experiments (∗P < 0.05, ∗∗P < 0.01, ∗∗∗P < 0.001).
