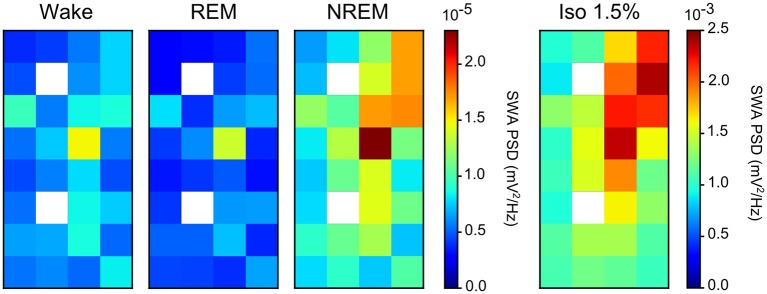
Figure 4.
Slow-wave activity (SWA) during both non-rapid eye-movement (NREM) sleep and isoflurane anesthesia: Mean SWA (1.5–5 Hz power; N = 4 birds) over all episodes of wake, rapid eye-movement (REM) sleep, NREM sleep, and low (1.5%) isoflurane episodes. SWA during NREM sleep and low anesthesia is the highest in the diagonal of the recording array (i.e., on the electrode sites that were placed in IHA/HI, the thalamic input layer). Image plots of SWA activity under 2.0, 2.5, and 3.0% isoflurane anesthesia showed the same pattern as the 1.5% anesthesia image plot (data not shown).

