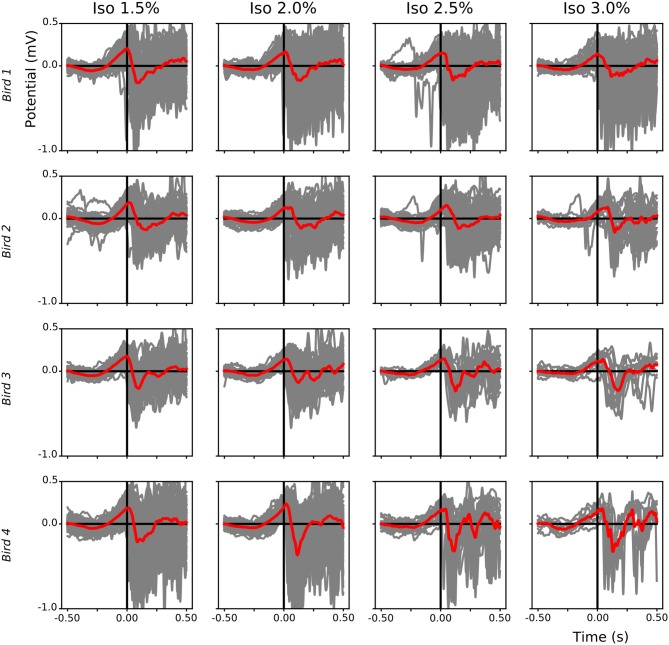
Figure 9.
Leading positive component of local field potential (LFP) slow-waves during isoflurane anesthesia: For each bird (different rows) the start of each slow-wave episode after a suppression period during different isoflurane levels was plotted (gray lines, mean in red). Slow-waves after a period of suppression start with a positive component followed by a sharp negative component.

