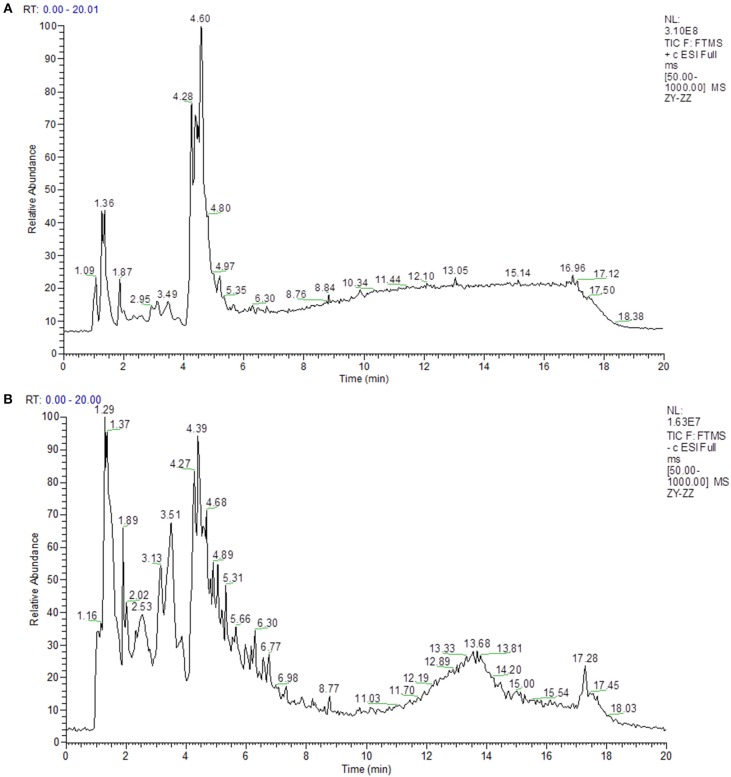
Figure 1.
The Total Ion Chromatogram of GD. (A) The Total Ion Chromatogram of GD (ESI+). (ESI+) represents the positive ion detection mode, in which the mass analyzer scans only positive charged ions and filters out negative charged ions to obtain positive charged ions information during the detection process. (B) The Total Ion Chromatogram of GD (ESI–). (ESI–) denotes the negative ion detection mode, in which the mass analyzer scans only negative charged ions and filters out positive charged ions, thus obtaining the information of negative charged ions.

