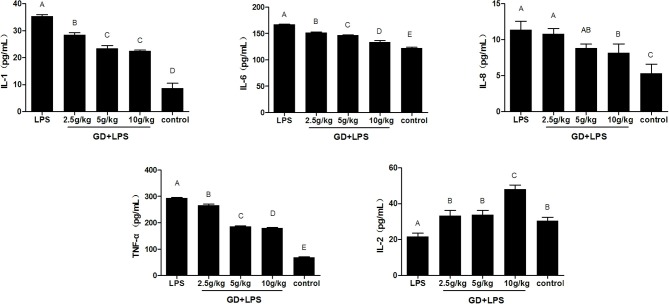
Figure 2.
Effects of GD on the production of inflammatory cytokines in the serum. The data are expressed as the mean ± SD (n = 10 per treatment group). The values with same superscript letters between groups are of no significant difference (P > 0.05), those with same letters are of significant difference (P < 0.05). Interleukin (IL)−1, IL-2, IL-6, IL-8, and Tumor necrosis factor (TNF)-α.

