
Figure 1.
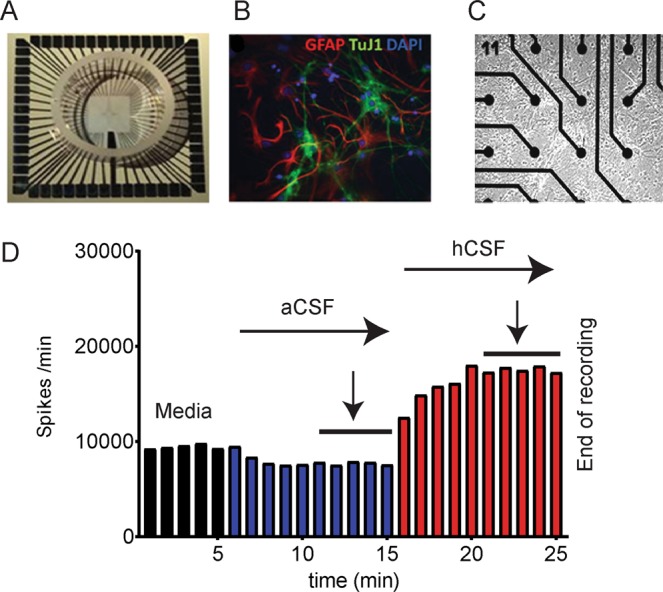
MEA System and experimental design. In (A) a whole MEA chip is depicted. In (B) a photomicrograph illustrates GFAP-positive (red) astrocytes and β−tubulin-positive (green) neurons. The blue color marks cell nuclei. (C) shows the neural population situated around some MEA electrodes. (D) Experimental design and exemplary spike rate response to exchange from culture media (black bars) to aCSF (blue bars) to hCSF (red bars). Measurements for quantification were taken at the last five minutes (marked by arrow) of aCSF and hCSF (of patients or healthy controls).