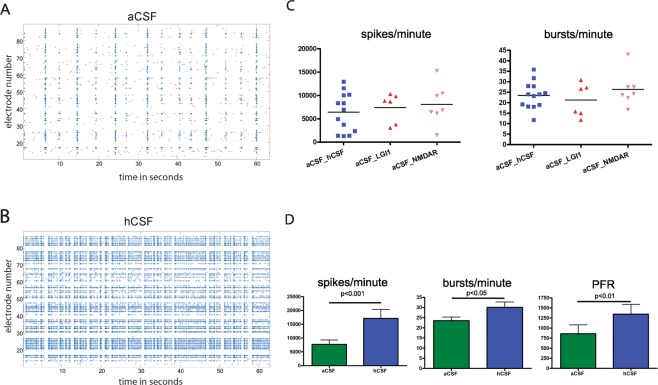
Figure 2.
Human control CSF increases ivNNA in comparison to artificial CSF. (A,B) Shown are spike raster plots (SRPs) with time in seconds on the x-axis and electrode numbers (1–100) on the y-axis. Every single dot represents an extracellularly detected spike from neurons nearby individual electrodes. If spikes appear vertically aligned, spatially distributed neurons fire synchronized sequences of spikes termed network bursts, separated by quiescent periods. Between network bursts, activity gaps can be seen (inter burst intervals) with only some non-synchronized spikes. Note, SRPs under the influence of hCSF show more densely packed network bursts. (C) Baseline spike and burst rates recorded in aCSF prior to application of either hCSF, pCSFLGI1 or pCSFNMDAR are shown: aCSF_LGI1, for instance, shows the baseline spike rate in aCSF before pCSFLGI1 was added. Only MEAs were used with a spike rate between 1,000 and 16,000 spikes/minute and a burst rate between 10 and 50 bursts/minute. The baseline spike rate per minute under aCSF of all 26 MEAs used for our experiments was between 1,287 and 15,236 (7,089 ± 766; 95% confidence interval 5,511–8,666). The burst rate per minute was between 12 and 43 (24 ± 1; 95% confidence interval 21–27). There was no significant difference between the baseline spike rates in the presence of aCSF used for later application of either hCSF, pCSFLGI1 or pCSFNMDAR (D).

