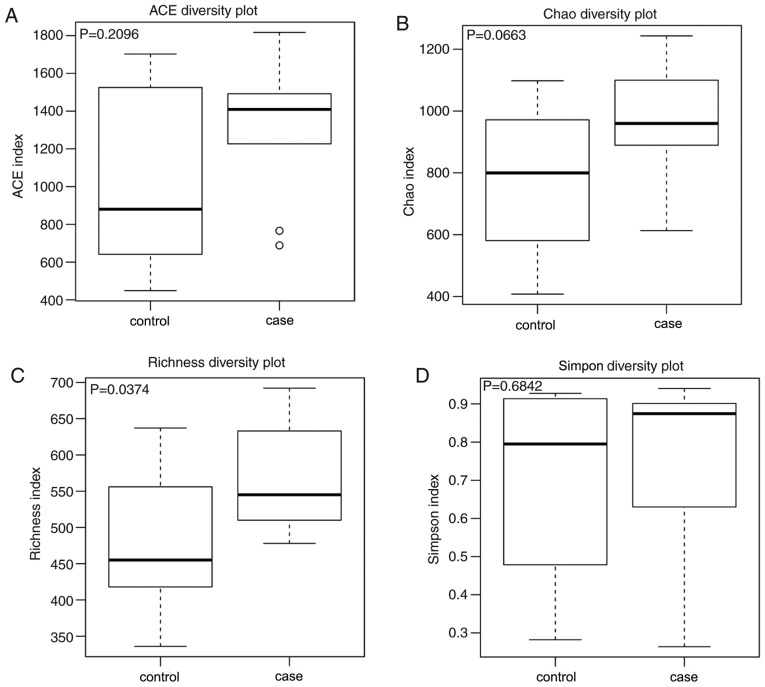
Figure 1.
Alpha diversity of the bacterial flora in the two group. (A) ACE diversity, (B) Chao diversity, (C) Richness diversity and (D) Simpon diversity. Box edges represent the quartiles, horizontal lines represent the medians, bars indicate edge values and circles indicate outliers. ACE, abundance-based coverage estimators.

