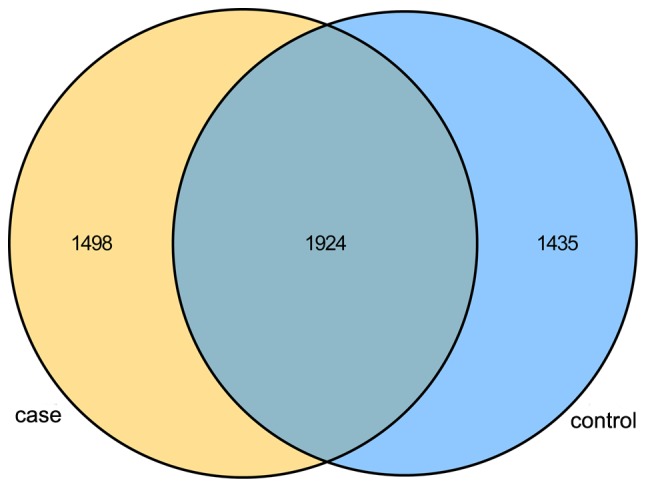
Figure 2.

Venn diagram of OTUs for different group samples. The yellow area was used to represent the case group and light blue area was used to represent the control group, while dark blue was used to represent the common OTUs of these two different groups. OTUs, operational taxonomic units.
