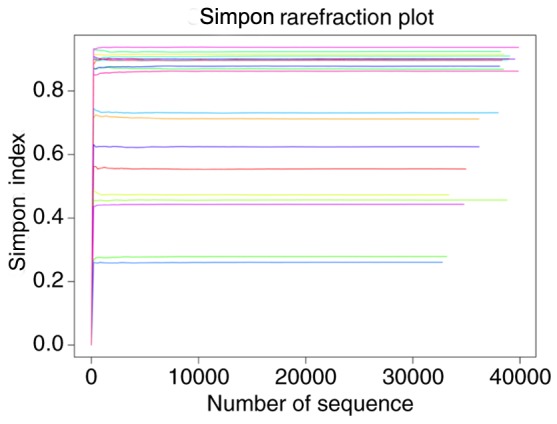
Figure 3.

Simpon rarefraction of all samples. The horizontal axis was used to represent the number of sequences, the vertical axis was used to represent the Simpon index and the curves of different colors were used to represent different samples.

Simpon rarefraction of all samples. The horizontal axis was used to represent the number of sequences, the vertical axis was used to represent the Simpon index and the curves of different colors were used to represent different samples.