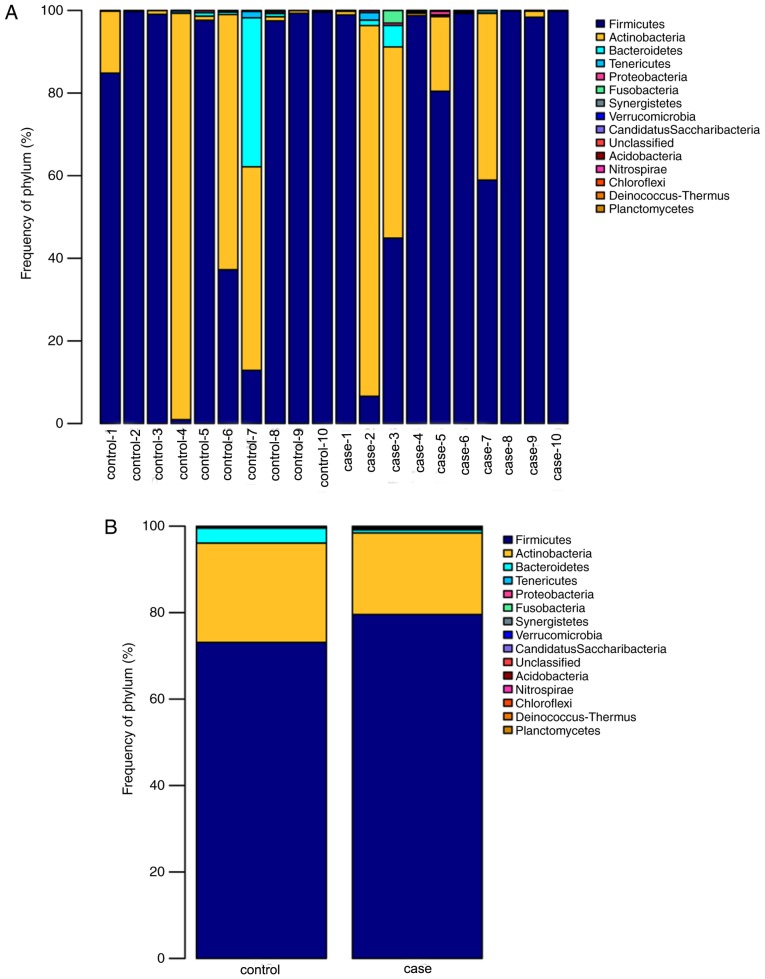
Figure 5.
Relative abundance of the predominant bacteria at the phylum level. The predominant taxa (>1% relative abundance) is presented. (A) Distribution of community components at the phylum level in each individual sample. (B) Group merge of community composition at the phylum level in all samples. The X-axis represents the different samples and the Y-axis represents the relative abundance ratio. Different colors represent the different phylums, and the different color block heights indicate the relative abundance ratio of different species.

