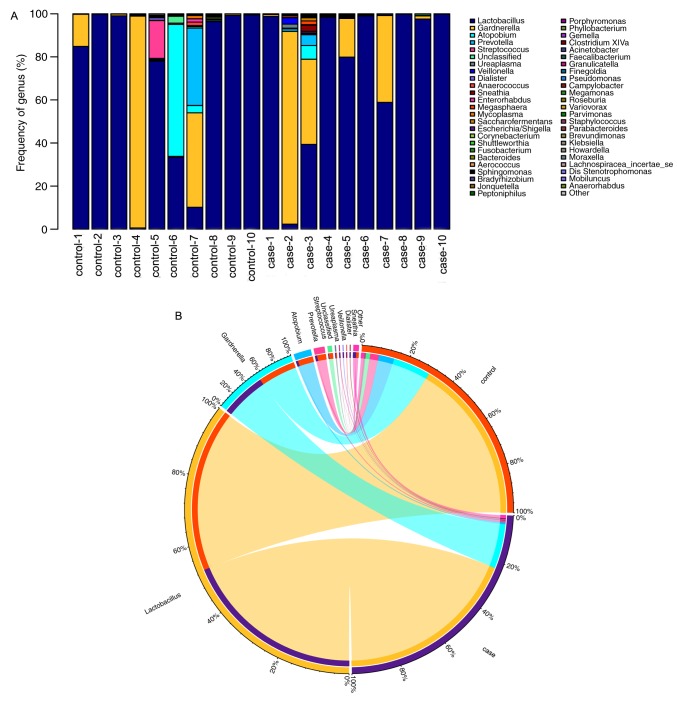
Figure 6.
Relative abundance of the predominant bacteria at the genus level. (A) Distribution of microbial community components in each sample at the genus level. The height of the bars for each genus indicates its relative abundance in the sample. (B) The data were visualized in a Circos presentation.

