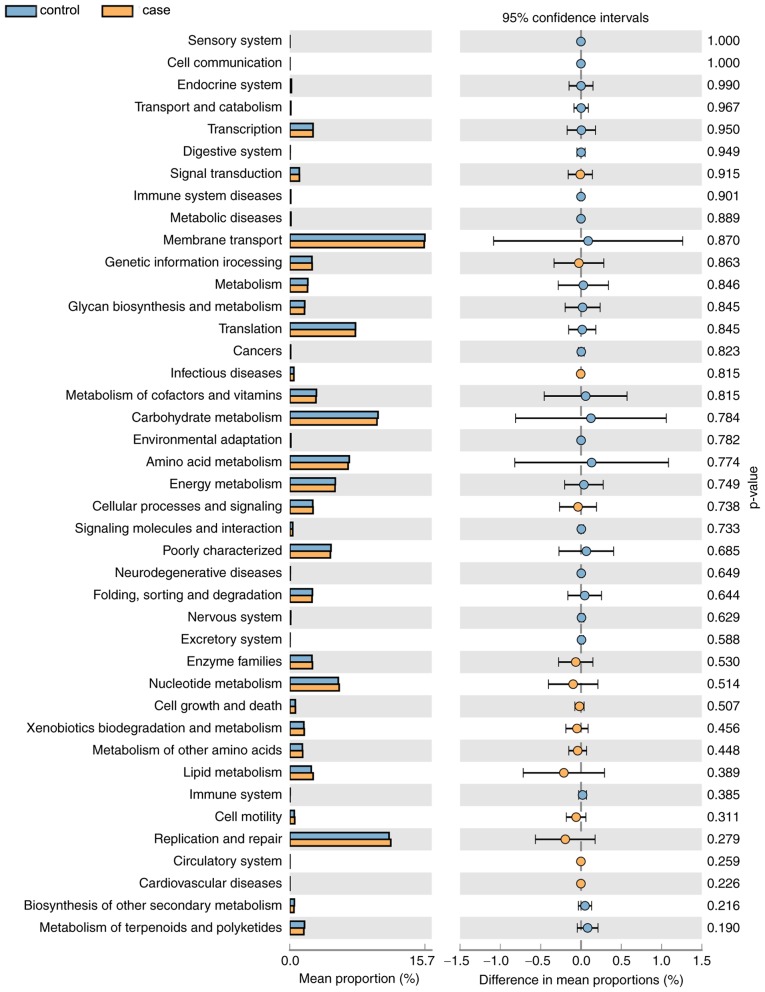
Figure 7.
Enriched Kyoto Encyclopedia of Genes and Genomes pathways of bacteria in the two groups. The left panel indicates the abundance ratio of the different functional pathways in the two groups, and the right panel indicates the difference in the mean proportion of the abundance of the functional pathways and the 95% confidence interval, as well as the P-values.

