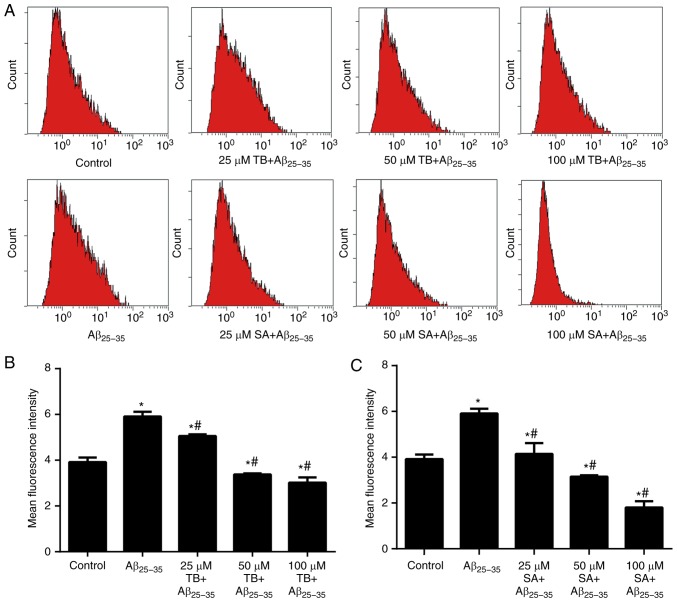
Figure 4.
Effects of TB and SA treatment on reactive oxygen species production of Aβ25-35-induced SH-SY5Y cells at different concentrations. (A) Mean fluorescence intensity was obtained using a dichlorofluorescin diacetate assay and quantified following (B) TB and (C) SA treatment. Control, Aβ25-35 alone, TB and SA treatments were performed using the same cells cultured and subsequently imaged at the same time. Therefore, results are presented in the same panel to improve comparisons. *P<0.05 vs. the control group; #P<0.05 vs. the Aβ25-35 group. TB, torenoside B; SA, savatiside A; Aβ, amyloid-beta.

