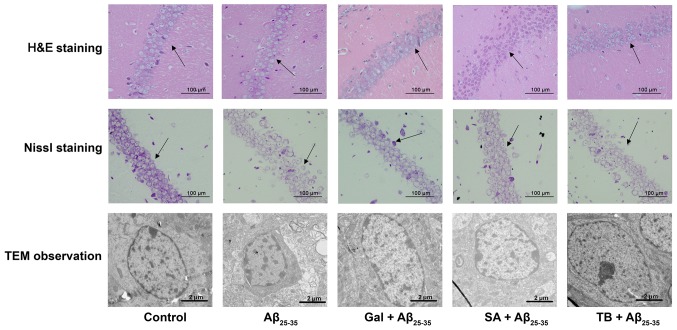
Figure 7.
Effect of TB and SA on the histopathological morphology (determined via H&E staining and Nissl staining) and the neuronal ultrastructure (determined via TEM; caliper=2.0 µm) of the hippocampal CA1 region of Aβ25-35-induced mice. Black arrows indicate neuronal structures and arranged cells in the hippocampus; TB, torenoside B; SA, savatiside A; H&E, hematoxylin and eosin; TEM, transmission electron microscopy; Aβ, amyloid-beta.

