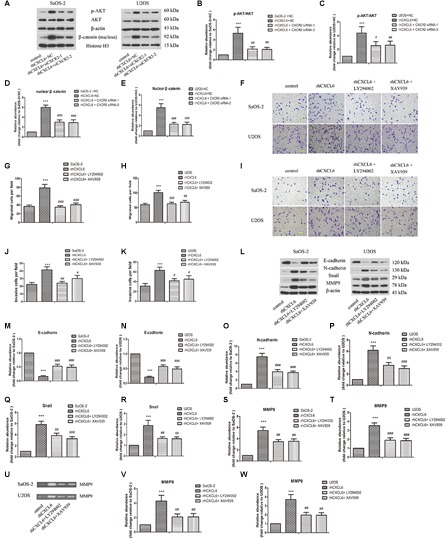
FIGURE 6.

PI3K/AKT and β-catenin signaling pathways participated in the regulation of migration, invasion and EMT by CXCL6/CXCR2 axis in OS cells. After transfection with siRNAs for 24 h, OS cells were treated with 100 ng/ml rhCXCL6 for 24 h. (A) The protein levels of p-AKT, AKT, and nuclear β-catenin in SaOS-2 and U2OS cells were detected by western blot assay. β-actin and Histone H3 were used as loading controls. (B–E) The protein quantification histograms were shown. OS cells were pre-treated with 50 μM LY294002 or 10 μM XAV939 for 1 h, then treated with 100 ng/ml rhCXCL6 for 24 h. (F) The migration of SaOS-2 and U2OS cells was detected by Transwell assay (no matrigel). Scal bar = 100 μm. (G,H) The number of migrated cells was shown. (I) The invasion of SaOS-2 and U2OS cells was determined by Transwell assay (matrigel). Scal bar = 100 μm. (J,K) The number of invasive cells was shown. (L) The protein levels of E-cadherin, N-cadherin, Snail, and MMP9 in SaOS-2 and U2OS cells were detected by western blot assay. (M–T) The protein quantification histograms were shown. (U) MMP-9 activity in the supernatant fluid of cultured SaOS-2 and U2OS cells was assessed by gelatin zymography assay. (V,W) The quantification histograms were shown. ∗∗∗P < 0.001, versus the OS cell or OS cell +NC group.#P < 0.05, ##P < 0.01, ###P < 0.001, versus the rhCXCL6+NC or rhCXCL6 group.
