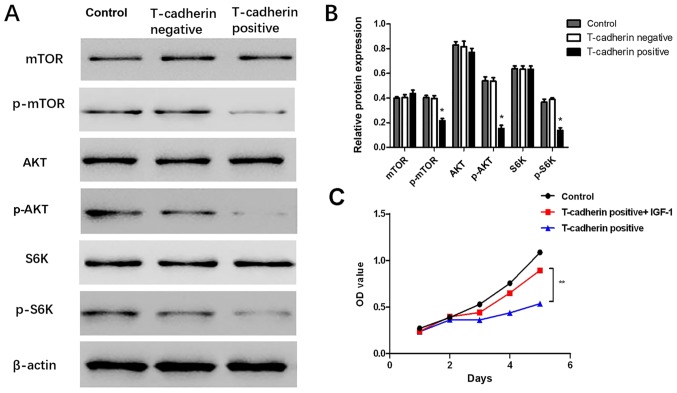
Figure 5.
T-cadherin overexpression inhibits the AKT/mTOR signaling pathway. HGC-27 cells transfected with pcDNA3.1-Tadherin and pcDNA3.1 were designated as T-cadherin-positive and negative groups, respectively. Untransfected HGC-27 cells served as blank controls. (A) Western blot analysis of AKT, mTOR and S6K and their phosphorylation products. (B) Relative protein expression determined vs. β-actin. (C) Effect of AKT pathway activator IGF-1 on cell proliferation phenotypes determined by MTT assay. *P<0.05 vs. T-cadherin-negative group, **P<0.05 vs. T-cadherin-positive group; n=5. AKT, protein kinase B; mTOR, mammalian target of rapamycin; S6K, ribosomal protein s6 kinase; p-, phosphorylated; IGF-1, insulin-like growth factor-1; OD, optical density.

