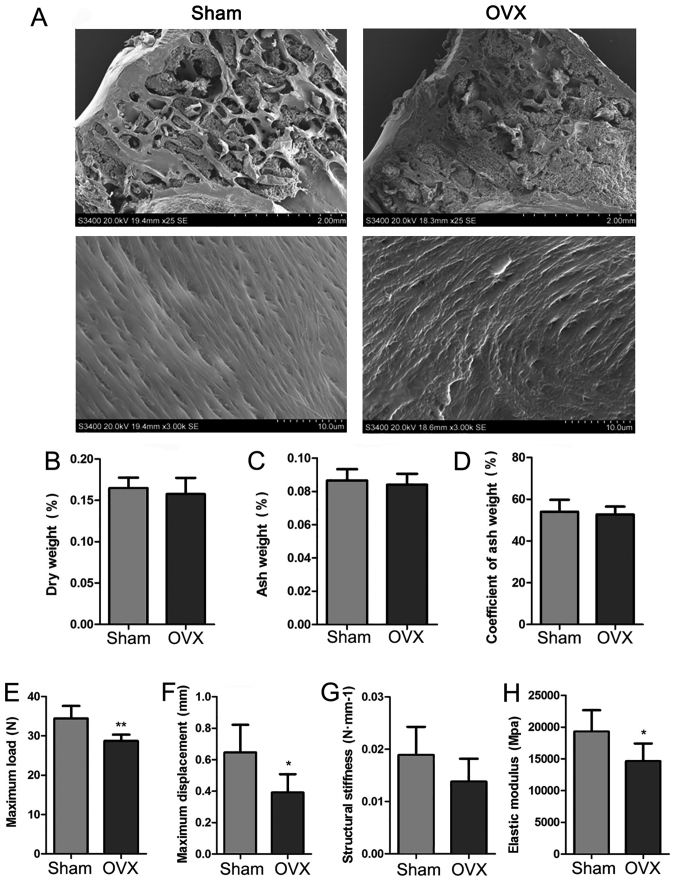
Figure 5.
Quality examination of tibia and humerus in the Sham and OVX groups. (A) Representative scanning electron microscopy images of the proximal epiphysis of the tibia (scale bars: in the 25-fold magnification the scale is 2 mm and in the 3-thousand-fold magnification 10 µm). (B-D) Determination of the coefficients obtained from bone dust of the right humerus of tree shrews, including (B) dry weight, (C) ash weight and (D) coefficient of ash weight. (E-H) Biomechanical study of the left humerus of tree shrews from the two groups, including (E) maximum load, (F) maximum displacement, (G) Structural stiffness and (H) elastic modulus. Values are expressed as the mean ± standard deviation (n=6). *P<0.05 and **P< 0.01 vs. the Sham group. OVX, ovariectomy.

